Welcome back, my budding hackers!
Digital forensics is one of IT's most rapid-growing disciplines. All hackers should be familiar with digital forensics if for no other reason than to protect themselves. More than one hacker has been apprehended because they were unaware of the evidence trail they left behind.
In my previous tutorial in this series, we looked at how to grab a forensic image of the RAM and pagefile.sys of a Windows system. We then used the open-source tool Volatility on our Kali OS to parse the type of image and the registry hives.
In this tutorial, we will look to find other information on that image that we can parse out that may have forensic significance. As we know, there is voluminous amount of information in the RAM of a running system that can reveal what the suspect was doing at the time of the system capture. This would include, of course, much of the same information we can get from Sysinternals from a running system, but here we are working with a memory image and not a running system. In most forensic investigations of a suspect's computer, we are working with a forensic image of the RAM and not the running system.
Before we start here, I am assuming that you have captured the memory image with one of the many memory-capturing tools such as FTK Imager and have parsed out the profile from the image with Volatility.
Parsing out the image profile is crucial, as each operating system stores information in different places in RAM. Volatility needs to know the profile (OS, service pack, and architecture) to know where to look in the memory image for the necessary information. If you put in the wrong profile information, Volatility will throw errors telling you it can't parse the information properly. In that case, try another image profile. Unfortunately, the profile image that this tool provides is not always correct.
Getting the List of Processes
As our first step, let's see if we can find the processes that the suspect had running when we captured the RAM image. We can do this by typing:
kali > python vol.py --profile Win7SP1x64 pslist -f /root/Desktop/memdump.mem
Let's break that down:
- python is the interpreter.
- vol.py is the name of the Volatility script.
- --profile Win7SP1x64 is the profile of the system the memory image was captured from.
- pslist is the plugin to parse out the running processes.
- -f /root/Desktop/memdump.mem is the location of the image file.
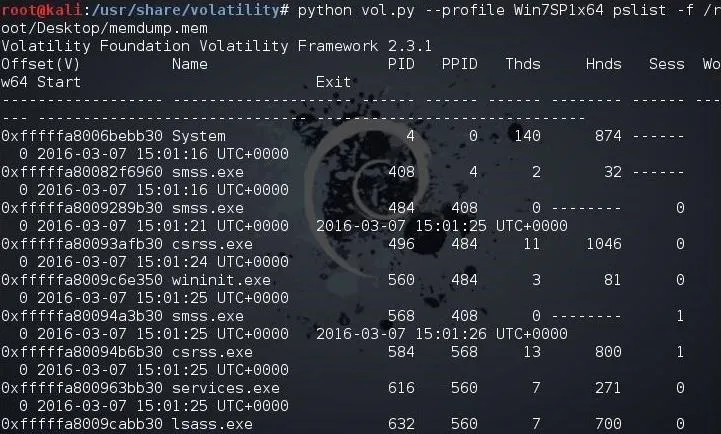
As you can see, Volatility has parsed out all the running processes. To gather even more information from the RAM image, we can use exactly the same command as above with the exception of changing the name of the plugin.
To get a list of available plugins you could use, type:
kali > python vol.py -h
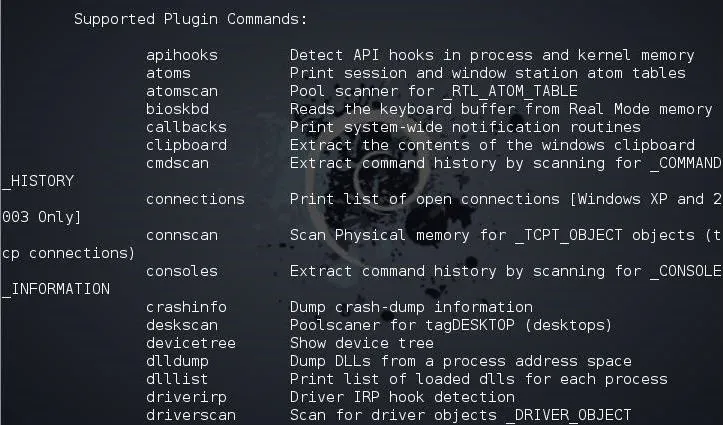
Getting the Running DLLs
To view the running DLLs on the system, we simply use the dlllist plugin like below:
kali > python vol.py --profile Win7SP1x64 dlllist -f /root/Desktop/memdump.mem
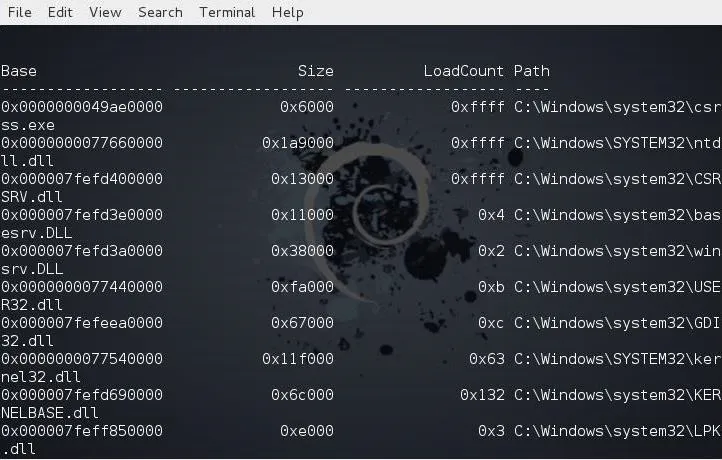
As you can see, Volatility parsed out a list of all the running DLLs.
Getting the Contents of the System's Clipboard
Sometimes, what the suspect had in their clipboard can be incriminating. We can retrieve the information from the suspect's RAM by using the clipboard plugin like below.
kali > python vol.py --profile Win7SP1x64 clipboard -f /root/Desktop/memdump.mem
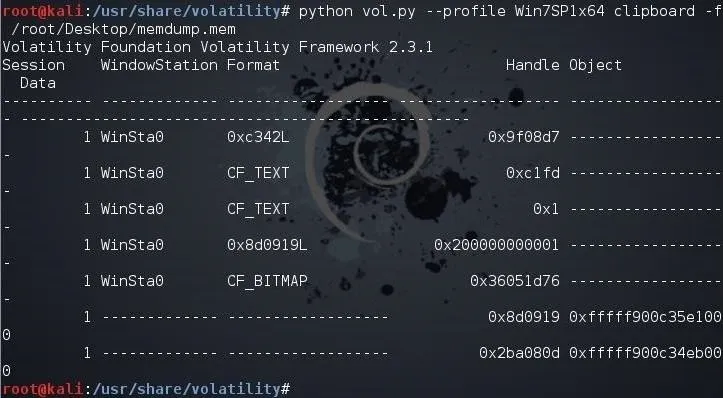
Unfortunately, all this information is in hexadecimal and must be translated to ASCII.
Getting a Timeline of Events
Often times, to prove that a suspect actually committed the action they are accused of, we may need a timeline of events that took place on that system. We can retrieve this timeline information from the memory image by using the timeliner plugin like below.
kali > python vol.py --profile Win7SP1x64 timeliner -f /root/Desktop/memdump.mem
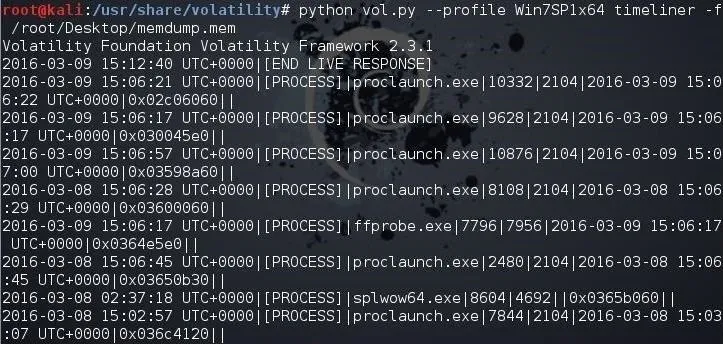
Note that each process is time stamped.
Looking for Malware in the Memory
Lastly, let's look for any malware running in the memory of the suspect system. Volatility has a plugin especially designed for this purpose, appropriately named malfind. We can use it like any other Volatility plugin. Simply type the same command as above but replace the name of the plugin with malfind.
kali > python vol.py --profile Win7SP1x64 malfind -f /root/Desktop/memdump.mem
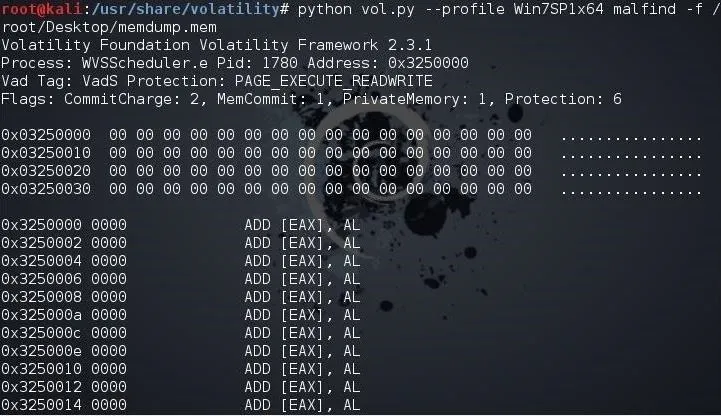
As you can see, this suspect had numerous pieces of malware running on their system. This information may actually be exculpating as the presence of malware would indicate that someone else had control of the system and may have committed the actions the suspect is accused of.
Keep coming back, my budding hackers, as we explore the world of digital forensics. Be safe!
Cover image via Shutterstock


Comments
Be the first, drop a comment!