


What if you could easily visualize which access point every Wi-Fi device nearby is connected to in a matter of seconds? While programs like Airodump-ng can intercept this wireless information, making it easy for hackers to use and understand is another challenge. Fortunately, a tool called Airgraph-ng can visualize the relationships between Wi-Fi devices from only a few seconds of wireless observation.
Signals Intelligence with Wi-Fi Devices
Signals intelligence is the science of understanding human behavior and systems behind intercepted radio signals. To understand how to attack a target, we want the maximum amount of information about the target surface area we have to consider. Without being connected to a network with encryption, like WPA or WPA2, we can't rely on tricks like sending packets to scan for other connected devices because we're on the outside looking in.
We can't read the traffic flowing between devices, but we can watch the relationship between Wi-Fi devices like laptops, smartphones, and IoT products to learn about the network and the people behind them. To understand how a network is connected, we can sniff the Wi-Fi radio traffic in the area to discover which devices are currently connected to an access point, building a list of relationships.
For an attacker, this means the ability to walk through a building and create a map of which access point every printer, security camera, and laptop is connected to. It's also possible to learn the names of networks nearby Wi-Fi devices have connected to recently, making it easy to create a fake network they will connect to automatically.
Making Intercepted Signals Readable
Another use for this kind of analysis is determining whether a device representing a person, like a smartphone, is present at a location. Creating a map of when someone comes and goes based on their Wi-Fi activity is an easy way of understanding when someone is home or using certain devices.
For this kind of signals analysis, Kismet is one of the best ways of scanning the relationships between nearby devices. In spite of how useful it is, setting it up takes work and interpreting the results isn't always straightforward. Here, after some setup, we're able to zero in on a popular public access point, learning about the devices that are currently connected to it.
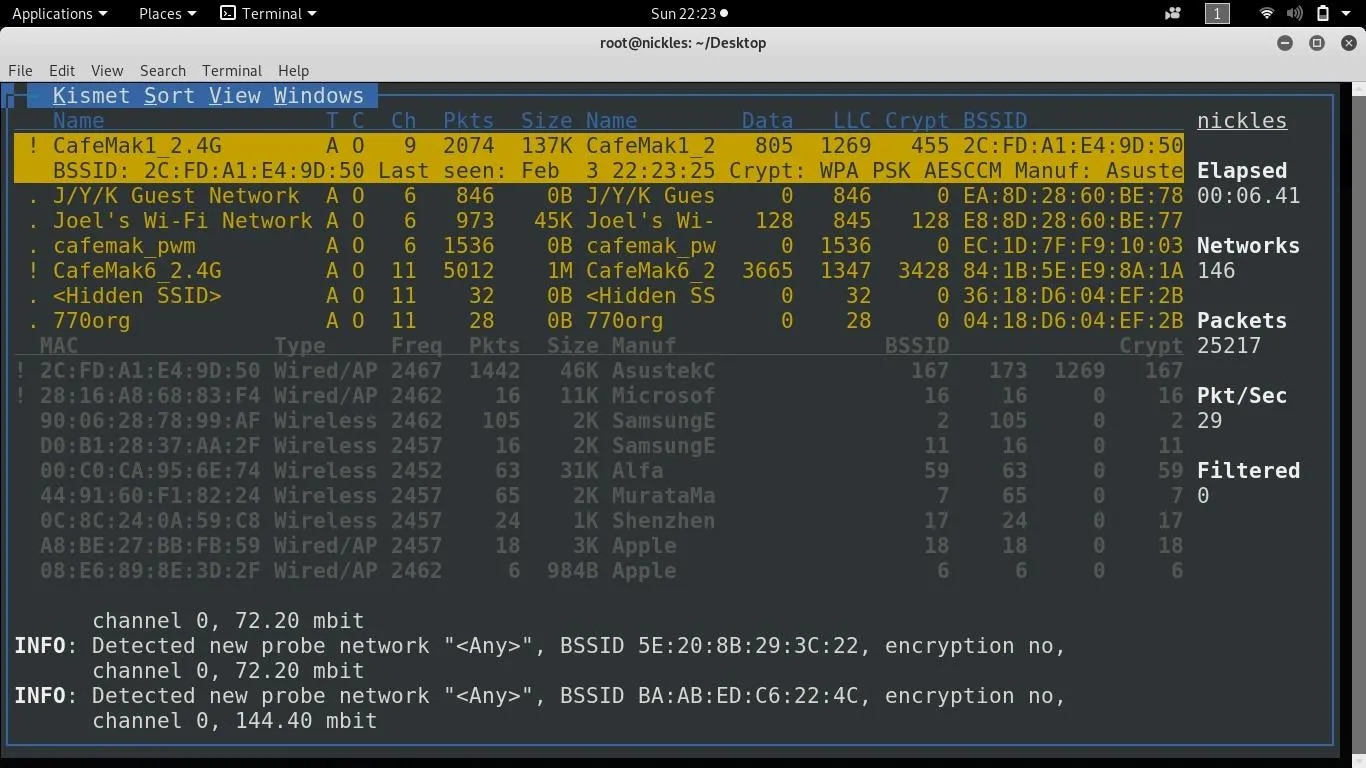
The information from Kismet is a lot for a beginner to absorb. While Kismet gives an operator the ability to discover and then spy on the Wi-Fi activity of any device connected to a nearby network Wi-Fi network, there is an easier way of showing a tactical snapshot of the local Wi-Fi environment.
Using Aigraph-ng, we can make a graphical version of this information. We can take all of this text data and convert it into a graphical snapshot of the relationships between nearby devices and the networks they are connected to. This gives immediate visibility to the topography of Wi-Fi networks in range.
Airgraph-Ng for Signals Interpretation
To learn about the topography of nearby networks and display the results as a graph, we'll need to collect and then process the data. For collection, we'll use a program installed by default in Kali Linux called Airodump-ng. This program will "dump" the Wi-Fi data packets we intercept with our wireless network adapter to a file. This CSV file will allow us to easily process what we've discovered and generate a PNG graph showing the relationships detected.
For processing the packets we intercept, we'll be using another program installed by default, Airgraph-ng. This program can visualize two types of information useful for a hacker. The first type of graph is a CAPR, or client access point relationship graph. This graph shows a map of every device currently connected to an access point and which network they are currently connected to.
The second kind of chart shows us the names of networks that W-Fi devices not currently connected to an access point are calling out for. This can reveal a list of networks we could create to lure nearby devices into connecting.
Airgraph-ng is pretty straightforward, as can be seen by its manual page entry.
NAME
       airgraph-ng - a 802.11 visualization utility

SYNOPSIS
       airgraph-ng [options]

DESCRIPITION
       airgraph-ng graphs the CSV file generated by Airodump-ng. The idea is that we are showing the
       relationships of the clients to the AP's so don't be shocked if you see only one  mapping  as
       you may only have captured one client

OPTIONS
       -h     Shows the help screen.

       -i     Airodump-ng CSV file

       -o     Output png file.

       -g     Choose the Graph Type. Current types are [CAPR (Client to AP Relationship) & CPG (Com‐
              mon probe graph)].

       -a     Print the about.

EXAMPLES
       airgraph-ng -i dump-01.csv -o dump.png -g CAPR

       airgraph-ng -i dump-01.csv -o dump.png -g CPG
What You'll Need
To follow along, you'll need a wireless network adapter capable of wireless monitor mode. You'll also want one compatible with Kali Linux.
You should be running Kali Linux in a virtual machine, dual-booted, or in another fashion that allows Kali to access the network adapter. If you're doing so in a virtual machine, you'll need to connect the USB adapter to the virtual machine for it to appear.
For this guide, you do not need to be connected to a network and you do not need permission to make these observations. The information is being broadcasted unencrypted, which means we are merely observing.
Update Your System & Install if Needed
If you're running Kali Linux, you should have everything you need installed. First, we'll need to update and ensure we have the Aircrack-ng suite. To do so, connect your Kali computer to the internet and run the following commands in a terminal window.
apt update
apt upgrade
apt install aircrack-ng
Now, let's check that we have the programs installed. Run the following commands to see the help output for each program.
airodump-ng --helpAirodump-ng 1.5.2 - (C) 2006-2018 Thomas d'Otreppe
https://www.aircrack-ng.org
usage: airodump-ng <options> <interface>[,<interface>,...]
Options:
--ivs : Save only captured IVs
--gpsd : Use GPSd
--write <prefix> : Dump file prefix
-w : same as --write
--beacons : Record all beacons in dump file
--update <secs> : Display update delay in seconds
--showack : Prints ack/cts/rts statistics
-h : Hides known stations for --showack
-f <msecs> : Time in ms between hopping channels
--berlin <secs> : Time before removing the AP/client
from the screen when no more packets
are received (Default: 120 seconds)
-r <file> : Read packets from that file
-x <msecs> : Active Scanning Simulation
--manufacturer : Display manufacturer from IEEE OUI list
--uptime : Display AP Uptime from Beacon Timestamp
--wps : Display WPS information (if any)
--output-format
<formats> : Output format. Possible values:
pcap, ivs, csv, gps, kismet, netxml, logcsv
--ignore-negative-one : Removes the message that says
fixed channel <interface>: -1
--write-interval
<seconds> : Output file(s) write interval in seconds
--background <enable> : Override background detection.
Filter options:
--encrypt <suite> : Filter APs by cipher suite
--netmask <netmask> : Filter APs by mask
--bssid <bssid> : Filter APs by BSSID
--essid <essid> : Filter APs by ESSID
--essid-regex <regex> : Filter APs by ESSID using a regular
expression
-a : Filter unassociated clients
By default, airodump-ng hops on 2.4GHz channels.
You can make it capture on other/specific channel(s) by using:
--ht20 : Set channel to HT20 (802.11n)
--ht40- : Set channel to HT40- (802.11n)
--ht40+ : Set channel to HT40+ (802.11n)
--channel <channels> : Capture on specific channels
--band <abg> : Band on which airodump-ng should hop
-C <frequencies> : Uses these frequencies in MHz to hop
--cswitch <method> : Set channel switching method
0 : FIFO (default)
1 : Round Robin
2 : Hop on last
-s : same as --cswitch
--help : Displays this usage screenairgraph-ng --helpUsage: airgraph-ng options [-o -i -g ]
Options:
-h, --help show this help message and exit
-o OUTPUT, --output=OUTPUT
Our Output Image ie... Image.png
-i INPUT, --dump=INPUT
Airodump txt file in CSV format. NOT the pcap
-g GRAPH_TYPE, --graph=GRAPH_TYPE
Graph Type Current [CAPR (Client to AP Relationship)
OR CPG (Common probe graph)]If you see the help output for both Airodump-ng and Airgraph-ng, then we're ready to start intercepting and interpreting packets!
Plug in Your Card & Enable Monitor Mode
Plug in the wireless network adapter you intend to use to sniff Wi-Fi packets. This should be a wireless network adapter that is compatible with Kali Linux. The Alfa AWUS036NHA is a solid one to use, but there are plenty more that may fit your needs better.
Once you've plugged in your adapter, we can put it into monitor mode by using another program installed with Aircrack-ng. We'll use Airmon-ng to put our card into monitor mode, after running ifconfig to get the name of our network adapter. In our example, our adapter is named "wlan2."
airmon-ng start wlan2Found 3 processes that could cause trouble.
Kill them using 'airmon-ng check kill' before putting
the card in monitor mode, they will interfere by changing channels
and sometimes putting the interface back in managed mode
PID Name
561 NetworkManager
627 wpa_supplicant
3561 dhclient
PHY Interface Driver Chipset
phy0 wlan0 ath9k Qualcomm Atheros QCA9565 / AR9565 Wireless Network Adapter (rev 01)
phy5 wlan2 rt2800usb Ralink Technology, Corp. RT2870/RT3070
(mac80211 monitor mode vif enabled for [phy5]wlan2 on [phy5]wlan2mon)
(mac80211 station mode vif disabled for [phy5]wlan2)Now, run ifconfig again. You should see that your card has mon added to the end. This means that your card is now in wireless monitor mode, and you're ready to proceed to the next step.
Run Airodump-Ng & Save CSV File
Now that our wireless card can listen in on any Wi-Fi packet in the area, we need to start recording this information to a file. We'll use Airodump-ng to do this, effectively dumping all packets received on our network adapter to a file for us to interpret later.
Remembering the name of our wireless network adapter which is now in monitor mode, run the following command to save all packets intercepted by the interface "wlan2mon" (or whatever yours is called) to a file named capturefile.
airodump-ng wlan2mon -w capturefilenameCH 10 ][ Elapsed: 4 mins ][ 2019-02-03 21:32
BSSID PWR Beacons #Data, #/s CH MB ENC CIPHER AUTH ESSID
14:CC:20:6D:22:BA -26 69 0 0 8 130 WPA2 CCMP PSK CafeMak4_2.4G
AA:6B:AD:6F:AC:55 -31 136 0 0 6 65 WPA2 CCMP PSK DIRECT-HQHL-L9310CDW_BRac55
EC:1D:7F:F9:10:03 -33 159 0 0 6 65 WPA2 CCMP PSK cafemak_pwm
2C:FD:A1:E4:9D:50 -40 109 152 0 9 260 WPA2 CCMP PSK CafeMak1_2.4G
84:1B:5E:E9:8A:1A -52 136 3668 0 11 54e WPA2 CCMP PSK CafeMak6_2.4G
16:18:D6:04:F1:1E -58 54 2 0 1 195 WPA2 CCMP PSK 770staff1
26:18:D6:04:F1:1E -59 74 0 0 1 195 WPA2 CCMP PSK 770guest
F8:18:97:65:BC:F3 -59 50 0 0 1 130 WPA2 CCMP PSK ATT717_guest
06:18:D6:04:F1:1E -60 52 0 0 1 195 WPA2 CCMP PSK exec
04:18:D6:04:F1:1E -60 87 0 0 1 195 WPA2 CCMP PSK 770org
3C:36:E4:F7:6D:20 -61 84 0 0 6 130 WPA2 CCMP PSK ATT120
36:18:D6:04:EF:0F -62 71 0 0 6 195 WPA2 CCMP PSK <length: 0>
06:18:D6:04:EF:0F -62 66 0 0 6 195 WPA2 CCMP PSK exec
36:18:D6:04:F1:1E -62 64 0 0 1 195 WPA2 CCMP PSK <length: 0>
04:18:D6:04:EF:0F -63 123 0 0 6 195 WPA2 CCMP PSK 770org
F8:18:97:65:BC:F2 -64 46 5 0 1 130 WPA2 CCMP PSK ATT717
04:18:D6:04:2E:FA -64 44 0 0 1 195 WPA2 CCMP PSK rb
26:18:D6:04:EF:0F -64 97 0 0 6 195 WPA2 CCMP PSK 770guest
16:18:D6:04:EF:0F -64 78 0 0 6 195 WPA2 CCMP PSK 770staff1
A0:8C:FD:B7:9D:A9 -65 68 0 0 6 65 WPA2 CCMP PSK DIRECT-A8-HP OfficeJet 4650
E8:8D:28:60:BE:77 -68 63 3 0 6 195 WPA2 CCMP PSK Joel's Wi-Fi NetworkWhen we're done collecting packets, you can type Ctrl-c to stop the capture. This will generate a CSV file containing all the information we need.
Generate a Graph of AP Relationships (Connected Devices)
Now, it's time to generate our first graph from the wireless data we've intercepted. You can think of this data like metadata, telling us which devices were calling each other, but not what they were saying.
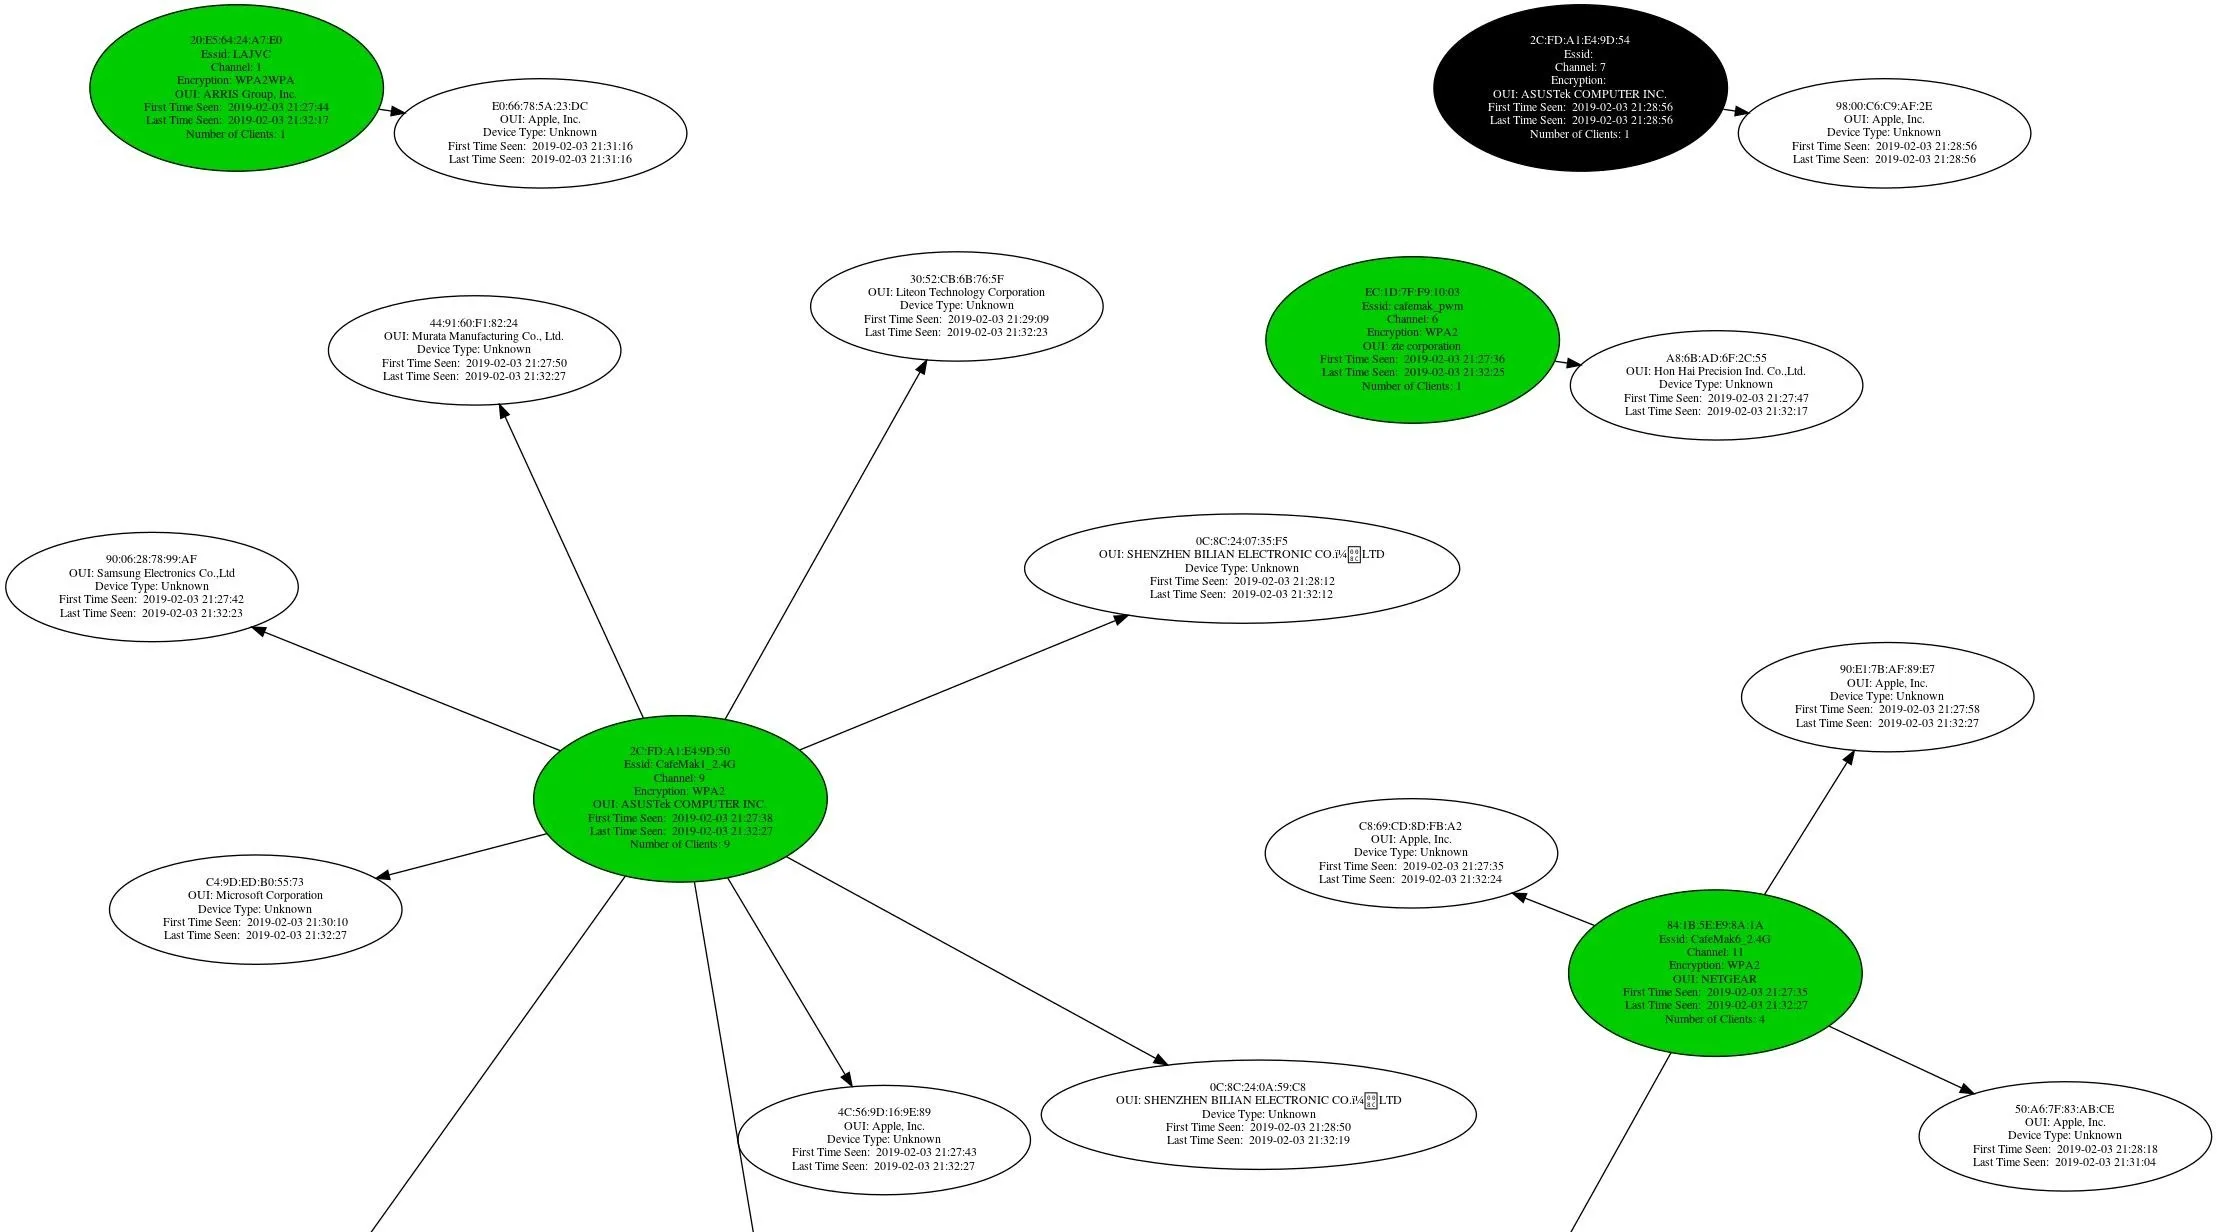
First, we'll start a graph of the client AP relationships. After locating the CSV file we created, run the following command in a terminal window to create a CAPR graph of which device is connected to which access point. Replace "CAPRintercept.png" with the name of the graph you want to create, and '/root/Desktop/cafemak-01.csv' with the path to the CSV file.
airgraph-ng -o CAPRintercept.png -i '/root/Desktop/cafemak-01.csv' -g CAPR**** WARNING Images can be large, up to 12 Feet by 12 Feet****
Creating your Graph using, /root/Desktop/cafemak-01.csv and writing to, cafemak.png
Depending on your system this can take a bit. Please standby......This should generate a graph to explore. Here we can see an example showing the relationship between access points and devices, clearly giving an overview of the local network topography.
Generate a Graph of Probe Frames (Disconnected Devices)
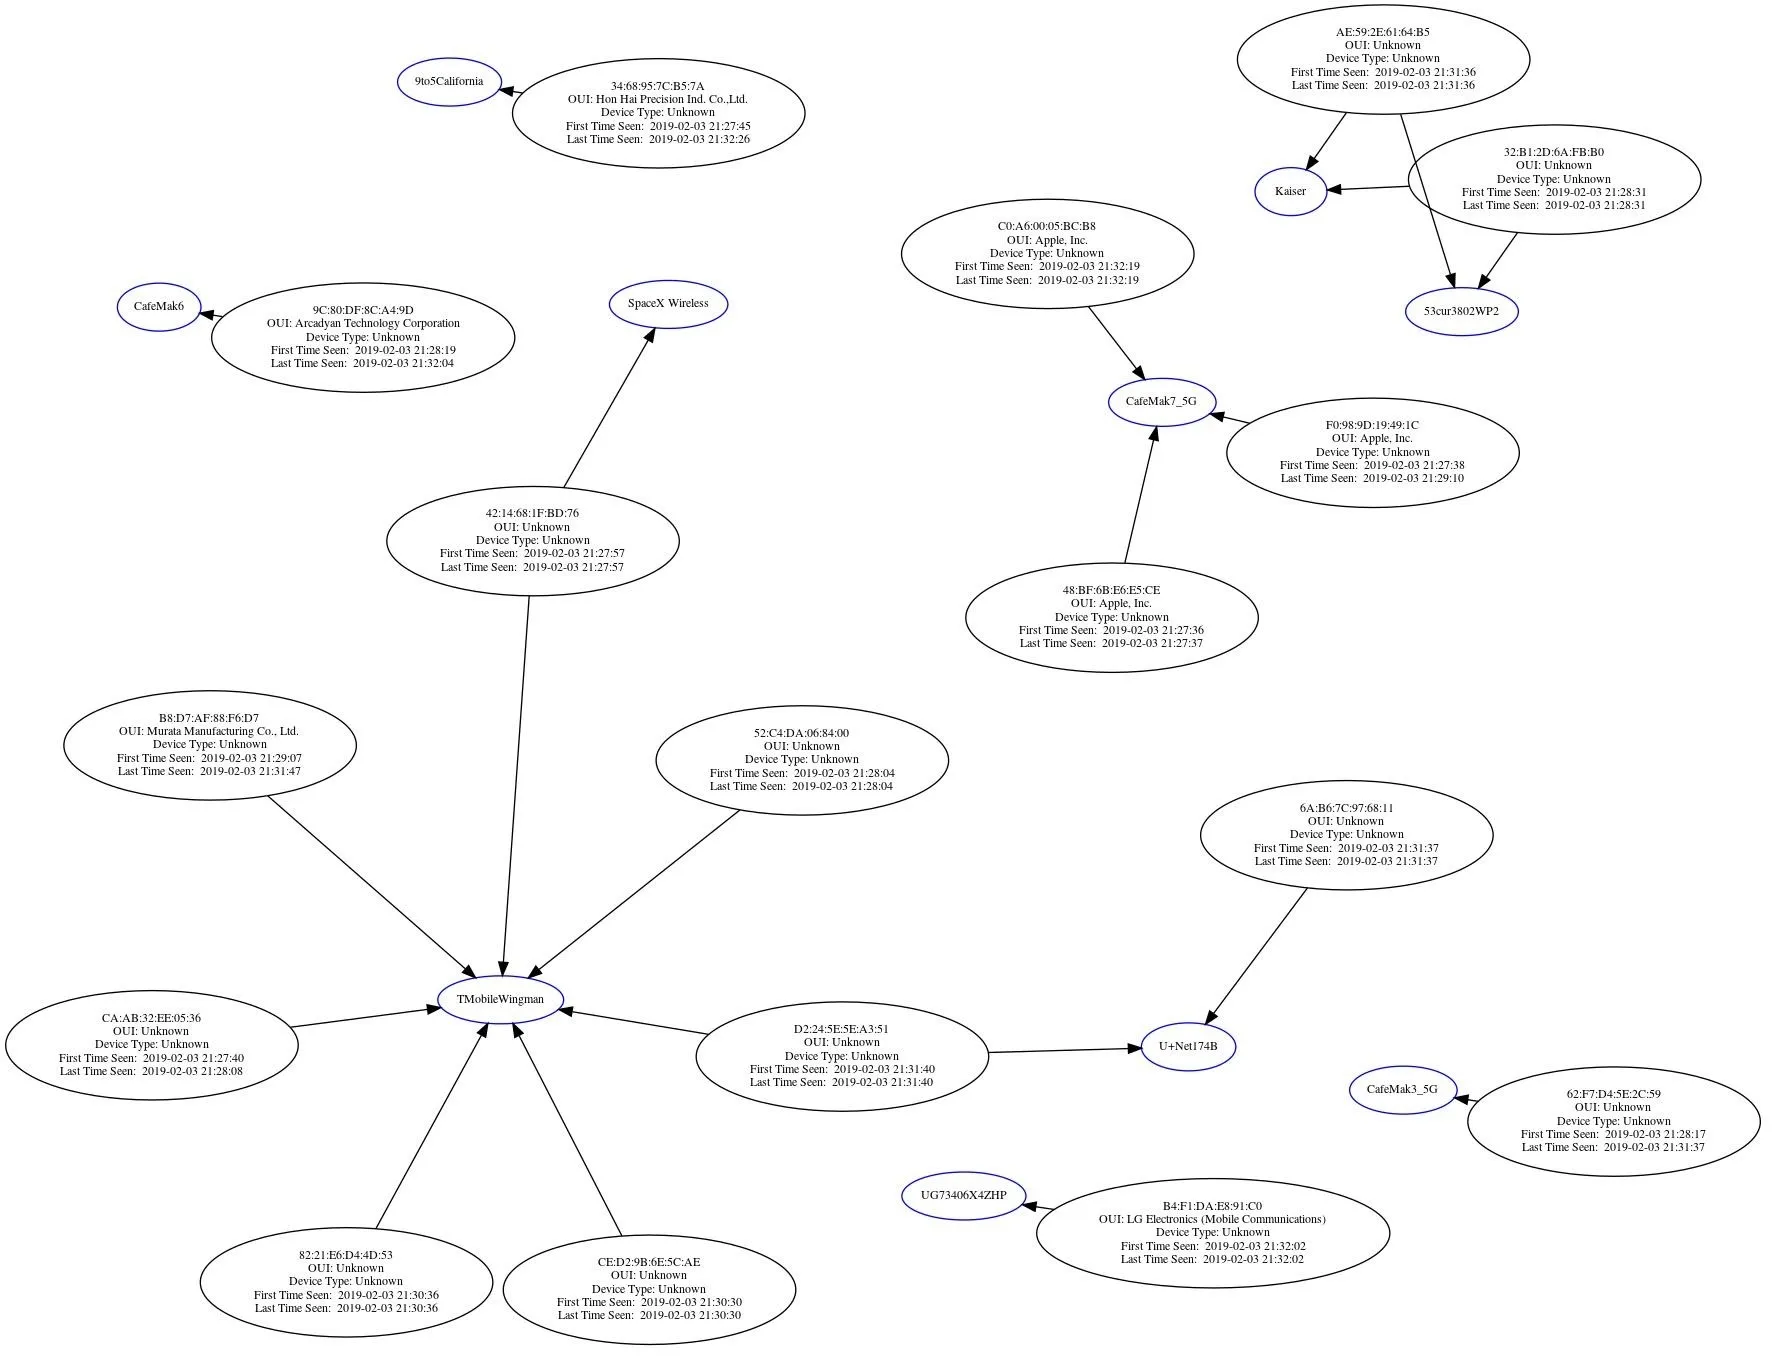
Next, let's target devices nearby which are not currently connected to an AP. From these devices, we can learn the names of networks they have been connected to before, allowing us to potentially trick them into connecting to a fake version with the same name.
To get this information, we'll just re-process the data we intercepted into a different kind of graph. There is no need to go back and collect more information, we're just going to visualize it in another way.
Open a terminal window and type the following commands, swapping out "CPGintercept.png" for the name of the file you want to save the graph under, and '/root/Desktop/cafemak-01.csv' again for the location of the CSV file you created earlier from the captured data.
airgraph-ng -o CPGintercept.png -i '/root/Desktop/cafemak-01.csv' -g CPG**** WARNING Images can be large, up to 12 Feet by 12 Feet****
Creating your Graph using, /root/Desktop/cafemak-01.csv and writing to, cafemak.png
Depending on your system this can take a bit. Please standby......Airgraph-ng should generate a new graph showing networks nearby devices are calling out for. This can allow you to also identify which networks can make multiple nearby devices connect.
Interpret the Results
For a hacker or penetration tester, the previous two graphs provide a goldmine of information. In the first, we're able to see which access point every nearby device is connected to, allowing us to isolate or capture clients onto fake MITM networks if we identify a target. Because of this, we can create a fake version of a network a device is currently connected to, kick them off the real network, and cause them to automatically connect to the fake version.
In the second graph, we're able to identify networks we could create that would cause several different devices to connect. These graphs can also reveal devices using MAC address randomization, because even devices that change their MAC address may call out for a network with a unique name as they continue to change their MAC.
Hackers can use this information about the type of hardware present and the way it's connected to come up with a plan of attack against a network. Because this attack is totally passive and requires no interaction with the network, the risk of being caught snooping on this information is almost nonexistent.
I hope you enjoyed this guide to using Airgraph-ng for Wi-Fi signals intelligence! If you have any questions about this tutorial on Wi-Fi recon or you have a comment, ask below or feel free to reach me on Twitter @KodyKinzie.
- Follow Null Byte on Twitter, Flipboard, and YouTube
- Sign up for Null Byte's weekly newsletter
- Follow WonderHowTo on Facebook, Twitter, Pinterest, and Flipboard
Cover photo and screenshots by Kody/Null Byte


Comments
Be the first, drop a comment!