

In the last tutorial, we learned how to make functions and how they work on the high level. This time, we will take a peek under the hood again, stare deep into its soul and see its ugliness face to face to see how it works in the lower level.
The Code Segment
The code segment, also referred to as the text segment, is a section in memory where the executable code resides, is fixed in size and is read-only. This segment is either placed below the stack or above the the heap to prevent heap or stack overflows from corrupting it.
Functions in Memory
Functions in memory are arranged in a similar manner to the variables on the stack. The main function is first loaded into memory and then the programmer's defined functions are stacked on top.
Example Code
Let's see the code from the previous tutorial again.
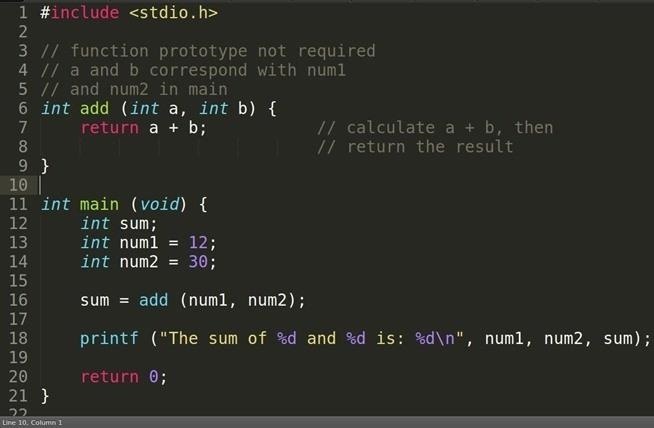
Since we will be analyzing this in memory, let's compile for debugging.
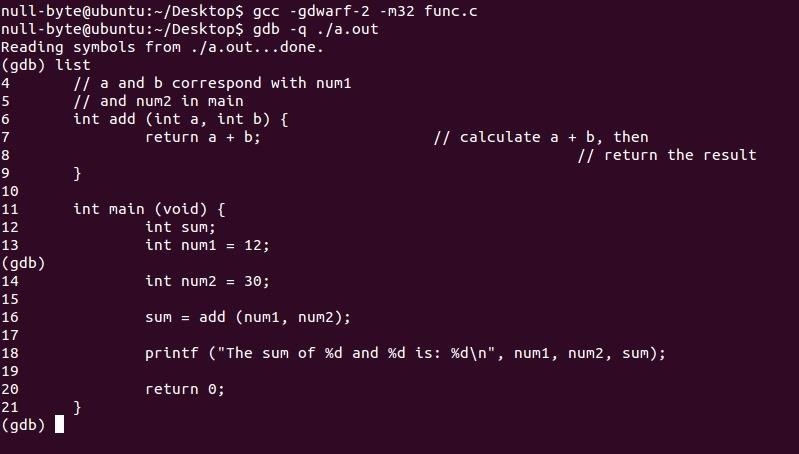
Compiling and Debugging
Here is our compiled code listed in GDB.
Since C code is a high level language, memory will not display it as such, instead it becomes something called machine code which is what the CPU executes. GDB will provide a translation from the machine code to the more readable Assembly language and it's able to do this because they have a one to one relationship. Let's see what each of these functions look like.
Here is the main function.
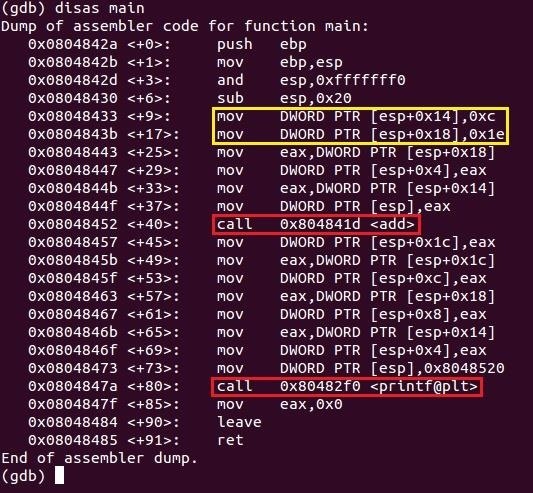
Okay, it looks pretty ugly... (told ya!). We can see the Intel x86 Assembly code for our C code so let me translate some of this to English. The way Intel syntax works is the instruction is written first (the middle column) followed by the destination register (registers are sort of like variables for the CPU) and then the source separated by a comma. In the yellow, the mov instruction tells two hex values to be moved into the location of ESP plus another set of hex values. We've discussed before that ESP identifies with the stack which is where our variables are found.
Let's first take a look at the instruction before the yellow box sub esp, 0x20. 0x20 is the hex value for the decimal 32 which gives it enough space to store our three variables: sum, num1 and num2. The first instruction in the yellow box mov DWORD PTR [esp+0x14], 0xc translates to move the hex value 0xc (decimal 12) into the address of ESP plus (moving down the stack) the hex value 0x14 (decimal 20). Looking back at our code, it must be the num1 variable. The second line does the same thing as the first except with a different location and value which matches the num2 variable.
The instructions then copy our variables by pushing (to place on top of the stack) them onto the stack and then calls our function add. So let's take a look at the function.
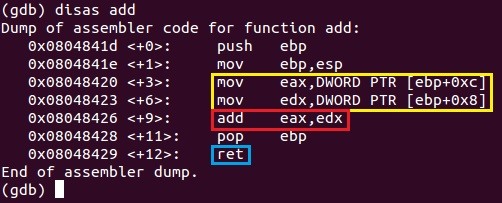
The add function moves our newly pushed variables into two registers: EAX and EDX (yellow) then sums them together and stores it into EAX (red). The function then returns (blue). In the world of Assembly, the return value is stored in the EAX register which is then copied into the sum variable in main. The add function then executes the ret instruction to return back to main's next instruction which is on main+45.
If you've notices, the addresses of the add function's instructions are lower than that of main's. Let's take a look at our code segment.
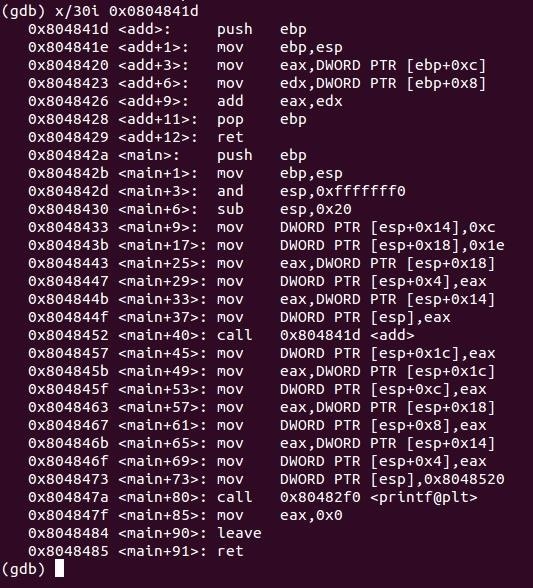
Yep, just like I explained before, our add function is stacked on top of main, kinda like the variables on the stack.
Conclusion
Try to wrap your head around the code segment. Next tutorial we will be going into more detail into functions, their parameters and how the return value finds it way back home. ...and maybe we'll discuss another vulnerability...
dtm.
Just updated your iPhone? You'll find new emoji, enhanced security, podcast transcripts, Apple Cash virtual numbers, and other useful features. There are even new additions hidden within Safari. Find out what's new and changed on your iPhone with the iOS 17.4 update.


1 Comment
You can set the disassembly syntax to Intel by typing, in the '(gdb)' prompt, set 'disassembly-flavour intel', without the quotation marks.
Share Your Thoughts